
(R Tutorials for Business Analyst)
R apply(), lapply(), sapply(), tapply() Function with Examples
This tutorial aims at introducing the apply() function collection. The apply() function is the most basic of all collection. We will also learn sapply(), lapply() and tapply(). The apply collection can be viewed as a substitute to the loop.
The apply() collection is bundled with r essential package if you install R with Anaconda. The apply() function can be feed with many functions to perform redundant application on a collection of object (data frame, list, vector, etc.). The purpose of apply() is primarily to avoid explicit uses of loop constructs. They can be used for an input list, matrix or array and apply a function. Any function can be passed into apply().
In this tutorial, you will learn
- apply() function
- lapply( )function
- sapply() function
- Slice vector
- tapply() function
apply() function
apply() takes Data frame or matrix as an input and gives output in vector, list or array. apply() Function is primarily used to avoid explicit uses of loop constructs. It is the most basic of all collections can be used over a matrice.
This function takes 3 arguments:
apply(X, MARGIN, FUN)
Here:
-x: an array or matrix
-MARGIN:  take a value or range between 1 and 2 to define where to apply the function:
-MARGIN=1`: the manipulation is performed on rows
-MARGIN=2`: the manipulation is performed on columns
-MARGIN=c(1,2)` the manipulation is performed on rows and columns
-FUN: tells which function to apply. Built functions like mean, median, sum, min, max and even user-defined functions can be applied>
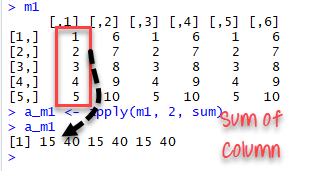
The simplest example is to sum a matrice over all the columns. The code apply(m1, 2, sum) will apply the sum function to the matrix 5×6 and return the sum of each column accessible in the dataset.
m1 <- matrix(C<-(1:10),nrow=5, ncol=6)
m1
a_m1 <- apply(m1, 2, sum)
a_m1
Output:
Best practice: Store the values before printing it to the console.
lapply() function
lapply() function is useful for performing operations on list objects and returns a list object of same length of original set. lappy() returns a list of the similar length as input list object, each element of which is the result of applying FUN to the corresponding element of list. lapply() takes list, vector or data frame as input and gives output in list.
lapply(X, FUN)
Arguments:
-X: A vector or an object
-FUN: Function applied to each element of x
l in lapply() stands for list. The difference between lapply() and apply() lies between the output return. The output of lapply() is a list. lapply() can be used for other objects like data frames and lists.
lapply() function does not need MARGIN.
A very easy example can be to change the string value of a matrix to lower case with tolower function. We construct a matrix with the name of the famous movies. The name is in upper case format.
movies <- c("SPYDERMAN","BATMAN","VERTIGO","CHINATOWN")
movies_lower <-lapply(movies, tolower)
str(movies_lower)
Output:
## List of 4
## $:chr"spyderman"
## $:chr"batman"
## $:chr"vertigo"
## $:chr"chinatown"
We can use unlist() to convert the list into a vector.
movies_lower <-unlist(lapply(movies,tolower))
str(movies_lower)
Output:
## chr [1:4] "spyderman" "batman" "vertigo" "chinatown"
sapply() function
sapply() function takes list, vector or data frame as input and gives output in vector or matrix. It is useful for operations on list objects and returns a list object of same length of original set. sapply() function does the same job as lapply() function but returns a vector.
sapply(X, FUN)
Arguments:
-X: A vector or an object
-FUN: Function applied to each element of x
We can measure the minimum speed and stopping distances of cars from the cars dataset.
dt <- cars
lmn_cars <- lapply(dt, min)
smn_cars <- sapply(dt, min)
lmn_cars
Output:
## $speed
## [1] 4
## $dist
## [1] 2
smn_cars
Output:
## speed  dist
##     4     2
lmxcars <- lapply(dt, max)
smxcars <- sapply(dt, max)
lmxcars
Output:
## $speed
## [1] 25
## $dist
## [1] 120
smxcars
Output:
## speed  dist
##    25   120
We can use a user built-in function into lapply() or sapply(). We create a function named avg to compute the average of the minimum and maximum of the vector.
avg <- function(x) {
  ( min(x) + max(x) ) / 2}
fcars <- sapply(dt, avg)
fcars
Output
## speed  dist
##  14.5  61.0
sapply() function is more efficient than lapply() in the output returned because sapply() store values direclty into a vector. In the next example, we will see this is not always the case.
R tutorials for Business Analyst – R List: Create, Select Elements with Example
We can summarize the difference between apply(), sapply() and `lapply() in the following table:
| Function | Arguments | Objective | Input | Output |
|---|---|---|---|---|
| apply | apply(x, MARGIN, FUN) | Apply a function to the rows or columns or both | Data frame or matrix | vector, list, array |
| lapply | lapply(X, FUN) | Apply a function to all the elements of the input | List, vector or data frame | list |
| sapply | sappy(X FUN) | Apply a function to all the elements of the input | List, vector or data frame | vector or matrix |
Slice vector
We can use lapply() or sapply() interchangeable to slice a data frame. We create a function, below_average(), that takes a vector of numerical values and returns a vector that only contains the values that are strictly above the average. We compare both results with the identical() function.
below_ave <- function(x) {
    ave <- mean(x)
    return(x[x > ave])
}
dt_s<- sapply(dt, below_ave)
dt_l<- lapply(dt, below_ave)
identical(dt_s, dt_l)
Output:
## [1] TRUE
tapply() function
tapply() computes a measure (mean, median, min, max, etc..) or a function for each factor variable in a vector. It is a very useful function that lets you create a subset of a vector and then apply some functions to each of the subset.
tapply(X, INDEX, FUN = NULL)
Arguments:
-X: An object, usually a vector
-INDEX: A list containing factor
-FUN: Function applied to each element of x
Part of the job of a data scientist or researchers is to compute summaries of variables. For instance, measure the average or group data based on a characteristic. Most of the data are grouped by ID, city, countries, and so on. Summarizing over group reveals more interesting patterns.
To understand how it works, let’s use the iris dataset. This dataset is very famous in the world of machine learning. The purpose of this dataset is to predict the class of each of the three flower species: Sepal, Versicolor, Virginica. The dataset collects information for each species about their length and width.
As a prior work, we can compute the median of the length for each species. tapply() is a quick way to perform this computation.
data(iris)
tapply(iris$Sepal.Width, iris$Species, median)
Output:
##     setosa versicolor  virginica
##        3.4        2.8        3.0
Disclaimer: The information and code presented within this recipe/tutorial is only for educational and coaching purposes for beginners and developers. Anyone can practice and apply the recipe/tutorial presented here, but the reader is taking full responsibility for his/her actions. The author (content curator) of this recipe (code / program) has made every effort to ensure the accuracy of the information was correct at time of publication. The author (content curator) does not assume and hereby disclaims any liability to any party for any loss, damage, or disruption caused by errors or omissions, whether such errors or omissions result from accident, negligence, or any other cause. The information presented here could also be found in public knowledge domains.
Learn by Coding: v-Tutorials on Applied Machine Learning and Data Science for Beginners
Latest end-to-end Learn by Coding Projects (Jupyter Notebooks) in Python and R:
All Notebooks in One Bundle: Data Science Recipes and Examples in Python & R.
End-to-End Python Machine Learning Recipes & Examples.
End-to-End R Machine Learning Recipes & Examples.
Applied Statistics with R for Beginners and Business Professionals
Data Science and Machine Learning Projects in Python: Tabular Data Analytics
Data Science and Machine Learning Projects in R: Tabular Data Analytics
Python Machine Learning & Data Science Recipes: Learn by Coding
R Machine Learning & Data Science Recipes: Learn by Coding
Comparing Different Machine Learning Algorithms in Python for Classification (FREE)
There are 2000+ End-to-End Python & R Notebooks are available to build Professional Portfolio as a Data Scientist and/or Machine Learning Specialist. All Notebooks are only $29.95. We would like to request you to have a look at the website for FREE the end-to-end notebooks, and then decide whether you would like to purchase or not.
R tutorials for Business Analyst – R Data Types, Arithmetic & Logical Operators