
(Basic Statistics for Citizen Data Scientist)
Descriptive Statistics Tools
Excel provides a data analysis tool called Descriptive Statistics which produces a summary of the key statistics for a data set.
Example 1: Provide a table of the most common descriptive statistics for the scores in column A of Figure 1.

Figure 1 – Output from Descriptive Statistics data analysis tool
The output from the tool is shown in the right side of Figure 1. To use the tool, select Data > Analysis|Data Analysis and choose the Descriptive Statistics option. A dialog box appears as in Figure 2.

Figure 2 – Dialog box for Excel’s data analysis tool
Now click on Input Range and highlight the scores in column A (i.e. cells A3:A14). If you include the heading, as is done here, check Labels in first row. Since we want the output to start in cell C3, click the Output Range radio button and insert C3 (or click on cell C3). Finally click the Summary statistics checkbox and press the OK button.
Note that if we had also checked the Kth Largest checkbox, the output would also contain the value for LARGE(A4:A14, k) where k is the number we insert in the box to the right of the label Kth Largest. Similarly, checking the Kth Smallest checkbox outputs SMALL(A4:A14, k). The option Confidence Interval for Mean option generates a confidence interval using the t distribution.
Real Statistics Data Analysis Tool: The Real Statistics Resource Pack provides the supplemental Descriptive Statistics and Normality data analysis tool which outputs the above statistics plus GEOMEAN, HARMEAN, MAD, AAD and IQR. But instead of just generating the numerical value of each statistic, as is in Excel’s Descriptive Statistics data analysis tool, the Real Statistics tool outputs the appropriate Excel formula for computing each statistic (see Figure 4 below). Thus whenever the input data values change, the output values will change automatically as well.
Both Excel’s Descriptive Statistics and the Real Statistics Descriptive Statistics and Normality data analysis tools allow you to report on multiple sets of data at the same time, as shown in the following example.
Example 2 – Use Excel’s Descriptive Statistics data analysis tool as well as the Real Statistics Descriptive Statistics and Normality data analysis tool to show the descriptive statistics for the two samples on the left side of Figure 3.

Figure 3 – Output from Excel’s Descriptive Statistics data analysis tool
The output from the Excel Descriptive Statistics data analysis tool is given on the right side of Figure 3.
To use the Real Statistics data analysis tool, enter Ctrl-m and select the Descriptive Statistics and Normality option. A dialog box will now appear as shown in Figure 4. Insert A5:B18 into the Input Range, make sure Column headings included with data is checked and select the Descriptive Statistics option.
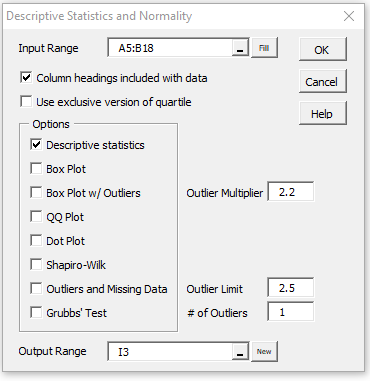
Figure 4 – Real Statistics Descriptive Statistics and Normality dialog box
After clicking the OK button, the output shown in Figure 5 is displayed.

Figure 5 – Real Statistics Descriptive Statistics data analysis tool
As described above, the tool actually generates formulas instead of the numerical values.
Statistics for Beginners – Introduction to Excel Data Analysis Tools
Statistics for Beginners with Excel – Descriptive Statistics Tools
Disclaimer: The information and code presented within this recipe/tutorial is only for educational and coaching purposes for beginners and developers. Anyone can practice and apply the recipe/tutorial presented here, but the reader is taking full responsibility for his/her actions. The author (content curator) of this recipe (code / program) has made every effort to ensure the accuracy of the information was correct at time of publication. The author (content curator) does not assume and hereby disclaims any liability to any party for any loss, damage, or disruption caused by errors or omissions, whether such errors or omissions result from accident, negligence, or any other cause. The information presented here could also be found in public knowledge domains.
Learn by Coding: v-Tutorials on Applied Machine Learning and Data Science for Beginners
Latest end-to-end Learn by Coding Projects (Jupyter Notebooks) in Python and R:
All Notebooks in One Bundle: Data Science Recipes and Examples in Python & R.
End-to-End Python Machine Learning Recipes & Examples.
End-to-End R Machine Learning Recipes & Examples.
Applied Statistics with R for Beginners and Business Professionals
Data Science and Machine Learning Projects in Python: Tabular Data Analytics
Data Science and Machine Learning Projects in R: Tabular Data Analytics
Python Machine Learning & Data Science Recipes: Learn by Coding
R Machine Learning & Data Science Recipes: Learn by Coding
Comparing Different Machine Learning Algorithms in Python for Classification (FREE)
There are 2000+ End-to-End Python & R Notebooks are available to build Professional Portfolio as a Data Scientist and/or Machine Learning Specialist. All Notebooks are only $29.95. We would like to request you to have a look at the website for FREE the end-to-end notebooks, and then decide whether you would like to purchase or not.