
(R Tutorials for Citizen Data Scientist)
Statistics with R for Business Analysts – Decision Tree
Decision tree is a graph to represent choices and their results in form of a tree. The nodes in the graph represent an event or choice and the edges of the graph represent the decision rules or conditions. It is mostly used in Machine Learning and Data Mining applications using R.
Examples of use of decision tress is − predicting an email as spam or not spam, predicting of a tumor is cancerous or predicting a loan as a good or bad credit risk based on the factors in each of these. Generally, a model is created with observed data also called training data. Then a set of validation data is used to verify and improve the model. R has packages which are used to create and visualize decision trees. For new set of predictor variable, we use this model to arrive at a decision on the category (yes/No, spam/not spam) of the data.
The R package “party” is used to create decision trees.
Install R Package
Use the below command in R console to install the package. You also have to install the dependent packages if any.
install.packages("party")
The package “party” has the function ctree() which is used to create and analyze decison tree.
Syntax
The basic syntax for creating a decision tree in R is −
ctree(formula, data)
Following is the description of the parameters used −
- formula is a formula describing the predictor and response variables.
- data is the name of the data set used.
Input Data
We will use the R in-built data set named readingSkills to create a decision tree. It describes the score of someone’s readingSkills if we know the variables “age”,”shoesize”,”score” and whether the person is a native speaker or not.
Here is the sample data.
# Load the party package. It will automatically load other
# dependent packages.
library(party)

# Print some records from data set readingSkills.
print(head(readingSkills))
When we execute the above code, it produces the following result and chart −
  nativeSpeaker   age   shoeSize      score
1           yes     5   24.83189   32.29385
2           yes     6   25.95238   36.63105
3            no    11   30.42170   49.60593
4           yes     7   28.66450   40.28456
5           yes    11   31.88207   55.46085
6           yes    10   30.07843   52.83124
Loading required package: methods
Loading required package: grid
...............................
...............................
Example
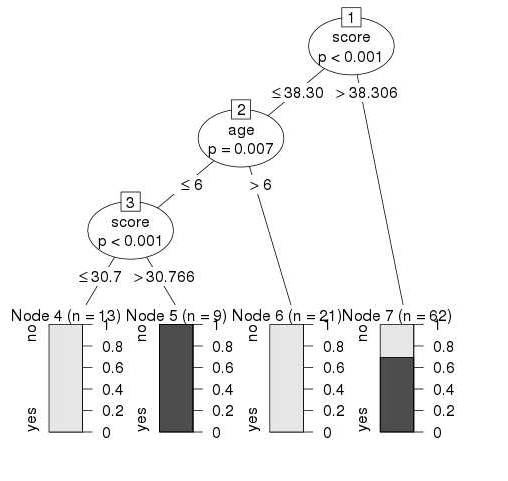
We will use the ctree() function to create the decision tree and see its graph.
# Load the party package. It will automatically load other
# dependent packages.
library(party)

# Create the input data frame.
input.dat <- readingSkills[c(1:105),]

# Give the chart file a name.
png(file = "decision_tree.png")

# Create the tree.
  output.tree <- ctree(
  nativeSpeaker ~ age + shoeSize + score,
  data = input.dat)

# Plot the tree.
plot(output.tree)

# Save the file.
dev.off()
When we execute the above code, it produces the following result −
null device
          1
Loading required package: methods
Loading required package: grid
Loading required package: mvtnorm
Loading required package: modeltools
Loading required package: stats4
Loading required package: strucchange
Loading required package: zoo

Attaching package: ‘zoo’

The following objects are masked from ‘package:base’:

   as.Date, as.Date.numeric

Loading required package: sandwich
Conclusion
From the decision tree shown above we can conclude that anyone whose readingSkills score is less than 38.3 and age is more than 6 is not a native Speaker.
Machine Learning Classification in Python using Decision Tree | Data Science Tutorial | IRIS dataset
Statistics with R for Business Analysts – Decision Tree
Disclaimer: The information and code presented within this recipe/tutorial is only for educational and coaching purposes for beginners and developers. Anyone can practice and apply the recipe/tutorial presented here, but the reader is taking full responsibility for his/her actions. The author (content curator) of this recipe (code / program) has made every effort to ensure the accuracy of the information was correct at time of publication. The author (content curator) does not assume and hereby disclaims any liability to any party for any loss, damage, or disruption caused by errors or omissions, whether such errors or omissions result from accident, negligence, or any other cause. The information presented here could also be found in public knowledge domains.
Learn by Coding: v-Tutorials on Applied Machine Learning and Data Science for Beginners
Latest end-to-end Learn by Coding Projects (Jupyter Notebooks) in Python and R:
All Notebooks in One Bundle: Data Science Recipes and Examples in Python & R.
End-to-End Python Machine Learning Recipes & Examples.
End-to-End R Machine Learning Recipes & Examples.
Applied Statistics with R for Beginners and Business Professionals
Data Science and Machine Learning Projects in Python: Tabular Data Analytics
Data Science and Machine Learning Projects in R: Tabular Data Analytics
Python Machine Learning & Data Science Recipes: Learn by Coding
R Machine Learning & Data Science Recipes: Learn by Coding
Comparing Different Machine Learning Algorithms in Python for Classification (FREE)
There are 2000+ End-to-End Python & R Notebooks are available to build Professional Portfolio as a Data Scientist and/or Machine Learning Specialist. All Notebooks are only $29.95. We would like to request you to have a look at the website for FREE the end-to-end notebooks, and then decide whether you would like to purchase or not.