
(Basic Statistics for Citizen Data Scientist)
Classification Table
The Classification Table compares the predicted number of successes to the number successes actually observed and similarly the predicted number of failures compared to the number actually observed.
We have four possible outcomes:
True Positives (TP) = the number of cases which were correctly classified to be positive, i.e. were predicted to be a success and were actually observed to be a success
False Positives (FP) = the number of cases which were incorrectly classified as positive, i.e. were predicted to be a success but were actually observed to be a failure
True Negatives (TN) = the number of cases which were correctly classified to be negative, i.e. were predicted to be a failure and were actually observed to be a failure
False Negatives (FN) = the number of cases which were incorrectly classified as negative, i.e. were predicted to be a negative but were actually observed to be a success
The Classification Table takes the form
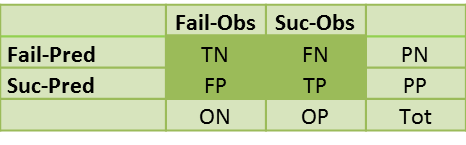
where PP = predicted positive = TP + FP, PN = predicted negative = FN + TN, OP = observed positive = TP + FN, ON = observed negative = FP + TN and Tot = the total sample size = TP + FP + FN + TN.
Example 1: A new spray is being tested for killing mosquitos. In particular the researchers want to discover the correct dosage of the spray. They tested 806 mosquitos with dosages varying from 0 μg to 20 μg and tabulated the number of mosquitos who died and lived in 2 μg dosage intervals as shown in range A24:C34 of Figure 1.
Create the classification table for a dosage of 10 μg or more. Success is viewed as mosquito died and failure is mosquito lived. A dosage of less than 10 μg is viewed as a prediction of failure (mosquito lives) and a dosage of 10 μg or more is viewed as a prediction of success (mosquito dies).
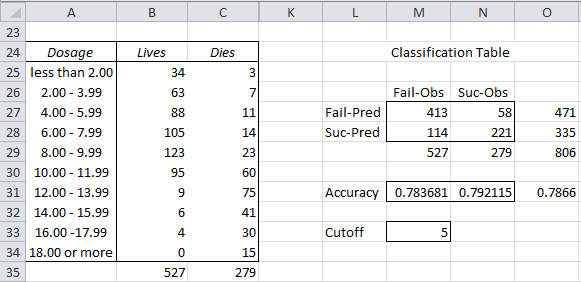
Figure 1 – Classification Table
We will use a cutoff value which corresponds to the last row in the table that is a failure, which in this case is row 5 (8.00 – 9.99).
For the data in Figure 1 we have
TN = 413 (cell M27), which can be calculated by the formula =SUM(B25:B29)
FN = 58 (cell N27), which can be calculated by the formula =SUM(C25:C29)
FP = 114 (cell M28), which can be calculated by the formula =B35-M27
TP = 221 (cell N28), which can be calculated by the formula = C35-N27
Note that FP is the type I error and FN is the type II error as described in Hypothesis Testing.
We now can define the following:
True Positive Rate (TPR), aka Sensitivity = TP/OP = 221/279 = .792115 (cell N31)
True Negative Rate (TNR), aka Specificity = TN/ON = 413/527 = .783681 (cell M31)
Accuracy (ACC) = (TP + TN)/Tot = (221+413) / 806 = .7866 (cell O31)
False Positive Rate (FPR) = 1 – TNR = FP/ON = 114/527 = .216319
Positive Predictive Value (PPV) = TP/PP = 221/335 = .659701
Negative Predictive Value (NPV) = TN/PN = 413/471 = .876858
Accuracy is a measure of the fit of the model (i.e. a dosage of 10 μg or more in this example). For Example 1 this is .7866, which means that the model gives an accurate prediction 78.66% of the time, or simply stated 78.66% of the mosquitos show the right outcome: they die when the dosage is 10 μg or more and live when the dosage is less than 10 μg.
Statistics for Beginners with Excel – Classification Table
Disclaimer: The information and code presented within this recipe/tutorial is only for educational and coaching purposes for beginners and developers. Anyone can practice and apply the recipe/tutorial presented here, but the reader is taking full responsibility for his/her actions. The author (content curator) of this recipe (code / program) has made every effort to ensure the accuracy of the information was correct at time of publication. The author (content curator) does not assume and hereby disclaims any liability to any party for any loss, damage, or disruption caused by errors or omissions, whether such errors or omissions result from accident, negligence, or any other cause. The information presented here could also be found in public knowledge domains.
Learn by Coding: v-Tutorials on Applied Machine Learning and Data Science for Beginners
Latest end-to-end Learn by Coding Projects (Jupyter Notebooks) in Python and R:
All Notebooks in One Bundle: Data Science Recipes and Examples in Python & R.
End-to-End Python Machine Learning Recipes & Examples.
End-to-End R Machine Learning Recipes & Examples.
Applied Statistics with R for Beginners and Business Professionals
Data Science and Machine Learning Projects in Python: Tabular Data Analytics
Data Science and Machine Learning Projects in R: Tabular Data Analytics
Python Machine Learning & Data Science Recipes: Learn by Coding
R Machine Learning & Data Science Recipes: Learn by Coding
Comparing Different Machine Learning Algorithms in Python for Classification (FREE)
There are 2000+ End-to-End Python & R Notebooks are available to build Professional Portfolio as a Data Scientist and/or Machine Learning Specialist. All Notebooks are only $29.95. We would like to request you to have a look at the website for FREE the end-to-end notebooks, and then decide whether you would like to purchase or not.