
(Basic Statistics for Citizen Data Scientist)
Two-sample Proportion Testing
Theorem 1: Let x1 and x2 be random variables with proportional distributions with mean π1 and π2 respectively. Let p1 be the proportion of successes in n1 trials of the first distribution and let p2 be the proportion of successes in n2 trials of the second distribution. When the number of trials n1 and n2 are sufficiently large, usually when ni πi ≥ 5 and ni (1 –πi) ≥ 5, the difference between the sample proportions p1 – p2 will be approximately normal with mean π1 – π2 and standard deviation
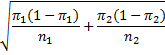
Proof: Based on Theorem 2 of the Binomial Distribution, xi has approximately the distribution
![]()
Since x1 and x2 are independently distributed, by the linear transformation property of the normal distribution, x1 – x2 has distribution
![]()
Example 1: A company that manufactures long-lasting light bulbs sells halogen and compact florescent bulbs. They ran an experiment in which they ran 100 halogen and 100 florescent bulbs continuously for 250 days. After 250 days they found that half of the halogen bulbs were still working while 60% of the florescent bulbs were still operating. Is there a significant difference between the two types of bulbs?
Let x1 = the percentage of halogen bulbs that are functional after 250 days and x2 = the percentage of florescent bulbs that are functional after 250 days. The presumption is that the distributions for each of these are proportional. We now test the following null hypothesis:
H0: π1 = π2
Assuming the null hypothesis is true, by Theorem 1, x1 – x2 will be approximately normal with mean π1 – π2 = 0 and standard deviation
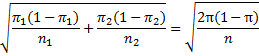
where the common value of the mean is denoted π and both samples are of size n. Since the value for π is unknown, we estimate its value from the sample, namely, 50 + 60 = 110 successes out of 200, i.e. π ≈ 0.55, Thus, the mean of x1 – x2 is 0 (based on the null hypothesis) and the standard deviation is approximately (.45)}{100}}")
p-value = NORMDIST(.1, 0, .704, TRUE) = .922 < .975 = 1 – α/2
Thus, we can’t reject the null hypothesis and so we cannot conclude there is a significant difference between the two types of bulbs. More precisely
p-value = 2*(1–NORM.DIST(.1, 0, .0703, TRUE)) = .155 > .05 = α
Alternatively, we can reach the same conclusion via the following test:
critical value of x1 – x2 = NORMINV(.975,0,.0703) = .138 > .1 = observed value of x1 – x2
Statistics with R for Business Analysts – Normal Distribution
Statistics for Beginners in Excel – Two-sample hypothesis testing
Disclaimer: The information and code presented within this recipe/tutorial is only for educational and coaching purposes for beginners and developers. Anyone can practice and apply the recipe/tutorial presented here, but the reader is taking full responsibility for his/her actions. The author (content curator) of this recipe (code / program) has made every effort to ensure the accuracy of the information was correct at time of publication. The author (content curator) does not assume and hereby disclaims any liability to any party for any loss, damage, or disruption caused by errors or omissions, whether such errors or omissions result from accident, negligence, or any other cause. The information presented here could also be found in public knowledge domains.
Learn by Coding: v-Tutorials on Applied Machine Learning and Data Science for Beginners
Latest end-to-end Learn by Coding Projects (Jupyter Notebooks) in Python and R:
All Notebooks in One Bundle: Data Science Recipes and Examples in Python & R.
End-to-End Python Machine Learning Recipes & Examples.
End-to-End R Machine Learning Recipes & Examples.
Applied Statistics with R for Beginners and Business Professionals
Data Science and Machine Learning Projects in Python: Tabular Data Analytics
Data Science and Machine Learning Projects in R: Tabular Data Analytics
Python Machine Learning & Data Science Recipes: Learn by Coding
R Machine Learning & Data Science Recipes: Learn by Coding
Comparing Different Machine Learning Algorithms in Python for Classification (FREE)
There are 2000+ End-to-End Python & R Notebooks are available to build Professional Portfolio as a Data Scientist and/or Machine Learning Specialist. All Notebooks are only $29.95. We would like to request you to have a look at the website for FREE the end-to-end notebooks, and then decide whether you would like to purchase or not.