
(Basic Statistics for Citizen Data Scientist)
Tolerance Interval
As described in Confidence Intervals, a confidence interval provides a way of estimating a population parameter by a corresponding sample statistic to a given level of confidence. We show how to estimate the population mean (the parameter) by the sample mean (the statistic). In particular, if the experiment is repeated a sufficiently large number of times, then the true population parameter will lie in the 1–α confidence interval in 100(1–α) percent of the samples.
The tolerance interval, on the other hand, is an interval pertaining to the entire population and not just to a specific parameter. In particular, we expect that 100(1–α) percent of the entire population will lie in the 1–α tolerance interval.
We now show how to calculate a tolerance interval based on sample data taken from a normal distributed population. In particular, we want to find an interval of the form
![]()
that contains p% of the population with 100(1–α)% confidence, where x̄ is the sample mean and s is the sample standard deviation
![]()
We provide the following estimate for k (due to Howe):
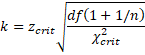
where n is the sample size, χ2crit is the critical value of the chi-square distribution at α with df = n–1 degrees of freedom and zcrit is the critical value of the standard normal distribution at the value where the cdf is (p+1)/2. Thus
![]()
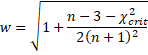
![]() Guenther recommends using wk instead of k, especially for smaller samples, where
Guenther recommends using wk instead of k, especially for smaller samples, where
There are also one sided tolerance intervals. In particular, we want to find the value of k such p% of the population falls in the interval (x̄–ks, ∞) with 100(1–α)% confidence. The same value of k will ensure that p% of the population falls in the interval (-∞, x̄+ks) with 100(1–α)% confidence.
We provide the following estimate for k (due to Natrella)
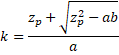
where![]()
and
zp = NORM.S.INV(p) zα = NORM.S.INV(α)
There is also an alternative estimate based on the noncentral t distribution, namely
![]()
where tcrit is the critical value at α of the noncentral t distribution T(n–1, zp√n). This can be calculated via the Real Statistics formula
tcrit = NT_INV(α, n–1, NORM.S.INV(p)*SQRT(n))
You can also estimate the sample size required to obtain a particular tolerance interval by using Excel’s Goal Seek capability.
Real Statistics Function: The Real Statistics Resource Pack contains the following function:
TOLERANCE_NORM(n, p, α, type) = k value of the tolerance interval for a normal distribution (actually k′ for the two-sided interval)
n = sample size, p = tolerance (default .9), α = significance level (default .05)
type = 2 (default) for two-sided interval, type = 1 for a one-side interval using a non-central t distribution and type = 0 for a one-sided interval using the Natrella approach.
Statistics for Beginners in Excel – Confidence Intervals for Sampling Distributions
Statistics for Beginners in Excel – Tolerance Interval using Real Statistics
Disclaimer: The information and code presented within this recipe/tutorial is only for educational and coaching purposes for beginners and developers. Anyone can practice and apply the recipe/tutorial presented here, but the reader is taking full responsibility for his/her actions. The author (content curator) of this recipe (code / program) has made every effort to ensure the accuracy of the information was correct at time of publication. The author (content curator) does not assume and hereby disclaims any liability to any party for any loss, damage, or disruption caused by errors or omissions, whether such errors or omissions result from accident, negligence, or any other cause. The information presented here could also be found in public knowledge domains.
Learn by Coding: v-Tutorials on Applied Machine Learning and Data Science for Beginners
Latest end-to-end Learn by Coding Projects (Jupyter Notebooks) in Python and R:
All Notebooks in One Bundle: Data Science Recipes and Examples in Python & R.
End-to-End Python Machine Learning Recipes & Examples.
End-to-End R Machine Learning Recipes & Examples.
Applied Statistics with R for Beginners and Business Professionals
Data Science and Machine Learning Projects in Python: Tabular Data Analytics
Data Science and Machine Learning Projects in R: Tabular Data Analytics
Python Machine Learning & Data Science Recipes: Learn by Coding
R Machine Learning & Data Science Recipes: Learn by Coding
Comparing Different Machine Learning Algorithms in Python for Classification (FREE)
There are 2000+ End-to-End Python & R Notebooks are available to build Professional Portfolio as a Data Scientist and/or Machine Learning Specialist. All Notebooks are only $29.95. We would like to request you to have a look at the website for FREE the end-to-end notebooks, and then decide whether you would like to purchase or not.