
(Basic Statistics for Citizen Data Scientist)
Real Statistics Power Data Analysis Tool
Real Statistics Data Analysis Tool: The Real Statistics Resource Pack supplies the Statistical Power and Sample Size data analysis tool to determine the power which results from a statistical test for a specified effect size, sample size and alpha, as well as the sample size required to achieve a specified effect size, power and alpha.
To use this tool, press Ctrl-m and select Statistical Power and Sample Size from the resulting menu. The dialog box in Figure 1 will then appear.
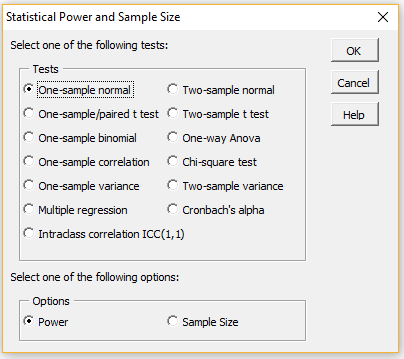 Figure 1 – Statistical Power and Sample Size dialog box
You can now select one of the specified twelve tests and either the Power or Sample Size options. E.g. if you choose the two-sample t test and the Power options, you will be presented with the dialog box shown on the left side of Figure 2.
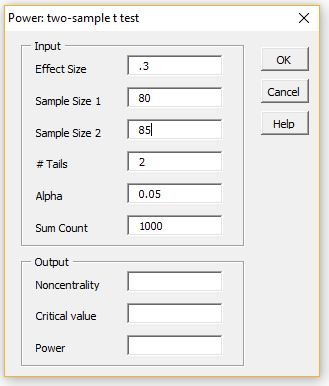
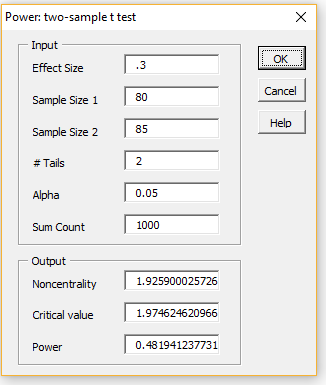
Figure 2 – Power: two-sample t test dialog box
Next fill in the Input fields, as shown on the right side of Figure 2 (retaining the default values of the # Tails, Alpha and Sum Count fields). After pressing the OK button you will see the results shown in Output area in the dialog box on the right side of the figure.
We see that the power of this test is 48.2% (we explain the other output fields elsewhere). To increase the power of the test for the given effect size, you would normally need to change from a two-tailed to a one-tailed test, increase the sample size(s), increase the alpha value or make some combination of these.
For this example if you change the # Tails to 2, you would increase Power to 60.8%. If you keep to a two-tailed test, you would need to increase alpha to .28 to obtain power of at least 80%, which is usually not very acceptable. Alternatively you could increase the sample sizes. E.g. to achieve a power of 80% you would need to increase the sample sizes to 176.
This can be determined by using the Sample Size option shown in Figure 1. You can do this by first pressing the Cancel button (on the dialog box in Figure 2) or the x in the upper right-hand corner of the dialog box. When the dialog box shown in Figure 1 reappears select the Sample Size option.
The dialog box shown on the left side of Figure 3 now appears. You need to insert .3 for the Effect Size and press the OK button. The result is shown on the right side of Figure 3, confirming that samples sizes of 176 are required. Note that the actual power achieved is a little more than 80%.
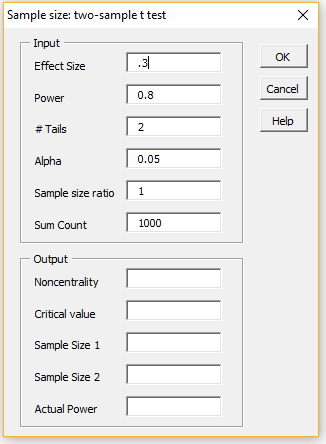
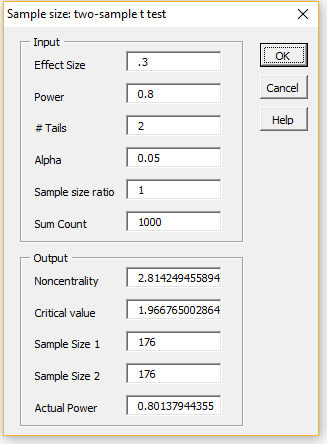
Figure 3 – Sample size: two-sample t test dialog box
Note that the Sample size ratio is set to 1, which means that the ratio n2/n1 = 1 (where n1 = size of sample 1 and n2 = size of sample 2), i.e. the samples are equal. If we wanted the size of the second sample to be twice that of the first sample we would set Sample size ratio to 2.
We could also specify that sample 2 has a specific size, say 100, by using a negative value for Sample size ratio, -100 in this case. Note that if we fix n2, then to achieve power of 80% for the above example, we would need a larger sample 1. In particular, we would need sample 1 to have size 695.
Statistics for Beginners – Introduction to Excel Data Analysis Tools
Statistics for Beginners in Excel – Real Statistics Power Data Analysis Tool
Disclaimer: The information and code presented within this recipe/tutorial is only for educational and coaching purposes for beginners and developers. Anyone can practice and apply the recipe/tutorial presented here, but the reader is taking full responsibility for his/her actions. The author (content curator) of this recipe (code / program) has made every effort to ensure the accuracy of the information was correct at time of publication. The author (content curator) does not assume and hereby disclaims any liability to any party for any loss, damage, or disruption caused by errors or omissions, whether such errors or omissions result from accident, negligence, or any other cause. The information presented here could also be found in public knowledge domains.
Learn by Coding: v-Tutorials on Applied Machine Learning and Data Science for Beginners
Latest end-to-end Learn by Coding Projects (Jupyter Notebooks) in Python and R:
All Notebooks in One Bundle: Data Science Recipes and Examples in Python & R.
End-to-End Python Machine Learning Recipes & Examples.
End-to-End R Machine Learning Recipes & Examples.
Applied Statistics with R for Beginners and Business Professionals
Data Science and Machine Learning Projects in Python: Tabular Data Analytics
Data Science and Machine Learning Projects in R: Tabular Data Analytics
Python Machine Learning & Data Science Recipes: Learn by Coding
R Machine Learning & Data Science Recipes: Learn by Coding
Comparing Different Machine Learning Algorithms in Python for Classification (FREE)
There are 2000+ End-to-End Python & R Notebooks are available to build Professional Portfolio as a Data Scientist and/or Machine Learning Specialist. All Notebooks are only $29.95. We would like to request you to have a look at the website for FREE the end-to-end notebooks, and then decide whether you would like to purchase or not.