
(Basic Statistics for Citizen Data Scientist)
Paired Sample t Test
In paired sample hypothesis testing, a sample from the population is chosen and two measurements for each element in the sample are taken. Each set of measurements is considered a sample. Unlike the hypothesis testing studied so far, the two samples are not independent of one another. Paired samples are also called matched samples or repeated measures.
For example, if you want to determine whether drinking a glass of wine or drinking a glass of beer has the same or different impact on memory, one approach is to take a sample of say 40 people, and have half of them drink a glass of wine and the other half drink a glass of beer, and then give each of the 40 people a memory test and compare results. This is the approach with independent samples.
Another approach is to take a sample of 20 people and have each person drink a glass of wine and take a memory test, and then have the same people drink a glass of beer and again take a memory test; finally we compare the results. This is the approach used with paired samples.
The advantage of this second approach is the sample can be smaller. Also since the sampled subjects are the same for beer and wine there is less chance that some external factor (confounding variable) will influence the result. The problem with this approach is that it is possible that the results of the second memory test will be lower simply because the person has imbibed more alcohol. This can be corrected by sufficiently separating the tests, e.g. by conducting the test with beer a day after the test with wine.
It is also possible that the order in which people take the tests influences the result (e.g. the subjects learn something on the first test that helps them on the second test, or perhaps taking the test the second time introduces a degree of boredom that lowers the score). One way to address these order effects is to have half the people drink wine on day 1 and beer on day 2, while for the other half the order is reversed (called counterbalancing).
The following table summarizes the advantages of paired samples versus independent samples:
| Paired Samples | Independent Samples |
| Need fewer participants | Fewer problems with fatigue or practice effects |
| Greater control over confounding variables | Participants are less likely to figure out the purpose of the study |
Figure 1 – Comparison of independent and paired samples
Obviously not all experiments can use the paired sample design. E.g. if you are testing differences between men and women, then independent samples will be necessary.
As you will see from the next example, the analysis of paired samples is made by looking at the difference between the two measurements. As a result, this case uses the same techniques as for the one sample case, although a type 1 TTEST or the paired sample data analysis tool can also be used.
Example 1: A clinic provides a program to help their clients lose weight and asks a consumer agency to investigate the effectiveness of the program. The agency takes a sample of 15 people, weighing each person in the sample before the program begins and 3 months later to produce the table in Figure 2. Determine whether the program is effective.

Figure 2 – Data for paired sample example
Let x = the difference in weight 3 months after the program starts. The null hypothesis is:
H0: μ = 0; i.e. any differences in weight is due to chance
We can make the following calculations using the difference column D:
s.e. = std dev /

tobs = (x̄ – μ) /s.e. = (10.93 – 0) /1.63 = 6.6896995
tcrit = TINV(α, df) = TINV(.05, 14) = 2.1447867
Since tobs > tcritwe reject the null hypothesis and conclude with 95% confidence that the difference in weight before and after the program is not due solely to chance.
Alternatively we can use a type 1 TTEST to perform the analysis as follows:
p-value = TTEST(B4:B18, C4:C18, 2, 1) = 1.028E-05 < .05 = α
and so once again we reject the null hypothesis.
As usual, for the results to be valid, we need to make sure that the assumptions for the t-test hold, namely that the difference measures are normally distributed or at least reasonably symmetric. From Figure 3 we see that this is the case:
")
Figure 3 – Box Plot for difference measures (column D of Figure 2)
We can also use either Excel’s t-Test: Paired Two Sample for Means data analysis tool or the T Test and Non-parametric Equivalents supplemental data analysis tool to get the same result. The output from the Excel data analysis tool is shown in Figure 4.

Figure 4 – Excel data analysis for paired samples
To use the data analysis version found in the Real Statistics Resource Pack, enter Ctrl-m and select T Tests and Non-parametric Equivalents from the menu. A dialog box will appear (as in Figure 3 of Two Sample t Test: Unequal Variances). Enter the input range B3:C18 and choose the Column headings included with the data, Paired Samples and T Test options and press the OK button. The output is shown in Figure 5.
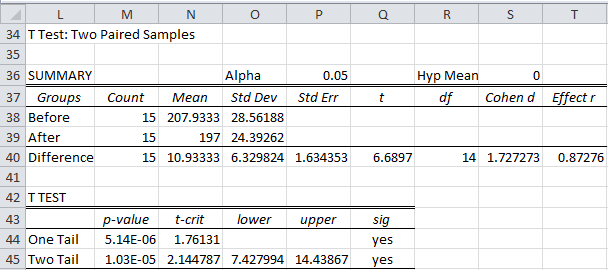
Figure 5 – Real Statistics data analysis for paired samples
We have seen all the items in the above table before with the exception of the Pearson Correlation. This is explored in Correlation.
Observation: Suppose we run the same analysis for the data in Example 1 from Two Sample t Test with Equal Variances using the t-test with independent samples and compare the results with those we obtained for paired samples:

Figure 6 – Excel data analysis for independent samples
We summarize the results from the two analyses as follows:

Figure 7 – Comparison of paired and independent sample t tests
Note that the mean differences are the same, but the standard deviation for the paired sample case is lower, which results in a higher t-stat and a lower p-value. This is generally true.
Observation: Although we have provided a supplemental data analysis tool for one sample tests, Excel doesn’t provide a standard data analysis tool for this case. The type 1 TTEST and paired samples data analysis tool can, however, be used for the one sample case by simply creating a null paired sample with all zero data.
Example 2: Repeat Example 1 of One Sample t-Test using the above observation.

Figure 8 – Use of paired sample data analysis for one sample test
Observation: Since the two sample paired data case is equivalent to the one sample case, we can use the same approaches for calculating effect size and power as we used in One Sample t Test. In particular, Cohen’s effect size is
![]()
where z = x1 – x2. There are other version of Cohen’s effect size, including drm and dav.
How to analyse and visualise Two-Samples-T-Test (Paired) in R
Statistics for Beginners in Excel – Paired Sample t Test
Disclaimer: The information and code presented within this recipe/tutorial is only for educational and coaching purposes for beginners and developers. Anyone can practice and apply the recipe/tutorial presented here, but the reader is taking full responsibility for his/her actions. The author (content curator) of this recipe (code / program) has made every effort to ensure the accuracy of the information was correct at time of publication. The author (content curator) does not assume and hereby disclaims any liability to any party for any loss, damage, or disruption caused by errors or omissions, whether such errors or omissions result from accident, negligence, or any other cause. The information presented here could also be found in public knowledge domains.
Learn by Coding: v-Tutorials on Applied Machine Learning and Data Science for Beginners
Latest end-to-end Learn by Coding Projects (Jupyter Notebooks) in Python and R:
All Notebooks in One Bundle: Data Science Recipes and Examples in Python & R.
End-to-End Python Machine Learning Recipes & Examples.
End-to-End R Machine Learning Recipes & Examples.
Applied Statistics with R for Beginners and Business Professionals
Data Science and Machine Learning Projects in Python: Tabular Data Analytics
Data Science and Machine Learning Projects in R: Tabular Data Analytics
Python Machine Learning & Data Science Recipes: Learn by Coding
R Machine Learning & Data Science Recipes: Learn by Coding
Comparing Different Machine Learning Algorithms in Python for Classification (FREE)
There are 2000+ End-to-End Python & R Notebooks are available to build Professional Portfolio as a Data Scientist and/or Machine Learning Specialist. All Notebooks are only $29.95. We would like to request you to have a look at the website for FREE the end-to-end notebooks, and then decide whether you would like to purchase or not.