
(Basic Statistics for Citizen Data Scientist)
Dealing with Missing Data
This tutorial is based on the Real Statistics Resource Pack.
Another problem faced when collecting data is that some data may be missing. For example, in conducting a survey with ten questions, perhaps some of the people who take the survey don’t answer all ten questions. In Identifying Outliers and Missing Data we show how to identify missing data using a supplemental data analysis tool provided in the Real Statistics Resource Pack.
A simple approach for dealing with missing data is to throw out all the data for any sample missing one or more data elements. One problem with this approach is that the sample size will be reduced. This is particularly relevant when the reduced sample size is too small to obtain significant results in the analysis. In this case, additional sample data elements may need to be collected. This problem is bigger than might first be evident. E.g. if a questionnaire with 5 questions is randomly missing 10% of the data, then on average almost 60% of the sample will have at least one question missing.
Also it is often the case that the missing data is not randomly distributed. E.g. people filling out a long questionnaire may give up at some point and not answer any further questions, or they may be offended or embarrassed by a particular question and choose not to answer it. These are characteristics that might be quite relevant to the analysis.
In general, there are the following types of remedies for missing data:
- Delete the samples with any missing data elements
- Impute the value of the missing data
- Remove a variable (e.g. a particular question in the case of a questionnaire or survey) that has a high incidence of missing data, especially if there are other variables (e.g. questions) that measure similar aspects of the characteristics being studied.
Deleting Missing Data
Of particular importance is the randomness of the missing data. E.g. suppose a lot of people didn’t answer question 5 but everyone answered question 7. If the frequency of the responses to question 7 changes significantly when samples which are missing responses to question 5 are dropped, then the missing data is not random, and so dropping samples can bias the results of the analysis. In this case, either another remedy should be employed or the analysis should be run twice: once with samples with missing data retained (e.g. by adding a “no response” for missing data) and once with these samples dropped.
Missing data can be removed by using the following functions found in the Real Statistics Resource Pack.
Real Statistics Functions:
DELBLANK(R1, s) – fills the highlighted range with the data in range R1 (by columns) omitting any empty cells
DELNonNum(R1, s) – fills the highlighted range with the data in range R1 (by columns) omitting any non-numeric cells
DELROWBLANK(R1, head, s) – fills the highlighted range with the data in range R1 omitting any row which has one or more empty cells; if head is TRUE then the first row of R1 (presumably containing column headings) is always copied (even if it contains an empty cell); this argument is optional and defaults to head = FALSE.
DELROWNonNum(R1, head, s) – fills the highlighted range with the data in range R1 omitting any row which has one or more non-numeric cells; if head is TRUE then the first row of R1 (presumably containing column headings) is always copied (even if it contains a non-numeric cell); this argument is optional and defaults to head = FALSE.
The string s is used as a filler in case the output range has more cells/rows than needed. This argument is optional and defaults to the error value #N/A. See Data Conversion and Reformatting for an example of the use of these functions.
The following additional function is useful with dynamic arrays.
DELROWS(R1, head, blank): outputs an array with the data in R1 omitting any row that has one or more blank elements if blank = TRUE or one or more non-numeric elements if blank = FALSE (default); if head = TRUE, then the first row is always included in the output; otherwise (default), the first row is treated like any other row.
In addition, there is the function CountFullRows(R1, blank) where blank = TRUE (default) or FALSE.
CountFullRows(R1, TRUE) = the number of rows in range R1 which don’t have any empty cells
CountFullRows(R1, FALSE) = the number of rows in range R1 which don’t have any non-numeric cells
There is also the related Real Statistics function CountPairs(R1, R2, blank) where blank = TRUE (default) or FALSE. Here we look at pairs of cells from R1 and R2: the ith cell in R1 is paired with the ith cell in R2
CountPairs(R1, R2, TRUE) = the number of pairs for which neither cell in the pair is empty
CountPairs(R1, R2, FALSE) = the number of pairs for which neither cell in the pair is empty or non-numeric
Note that in standard Excel the equivalent of CountPairs(R1, R2, TRUE) can be calculated by
=SUMPRODUCT(1-ISBLANK(R1),1-ISBLANK(R1))
CountPairs(R1, R2, FALSE) can be calculated by
=SUMPRODUCT(–ISNUMBER(R1),–ISNUMBER(R2))
To calculate the number of pair with equal numeric entries, we can use the formula
=SUMPRODUCT(–ISNUMBER(R1),–ISNUMBER(R2),–(R1=R2))
Example 1: Delete any missing data listwise (indicated by an empty cell) from the sample in A3:G22 in Figure 1.
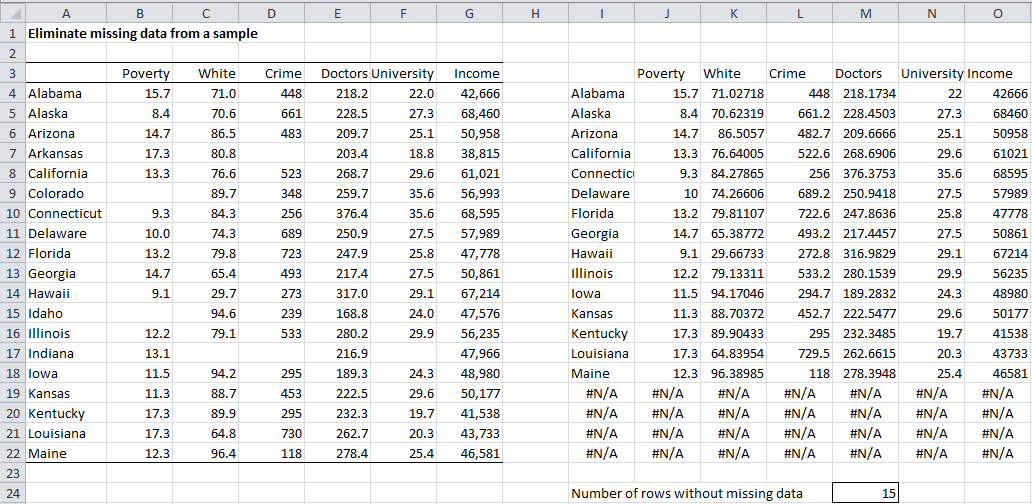
Figure 1 – Listwise deletion of missing data
Since we want to delete any row which contains one or more empty cells (except the first row which contains column titles), we use the following array formula to produce the output in range I3:O22 of Figure 1: =DELROWBLANK(A3:G22,TRUE).
The cell M24 contains the formula =CountFullRows(A4:G22).
Real Statistics Tools: The Real Statistics Resource Pack supplies the Reformatting a Data Range by Rows data analysis tool which provides easier-to-use versions of the supplemental DELROWBLANK and DELROWNonNum functions described above.
We can also use the supplemental Reformatting a Data Range data analysis tool as substitutes for the DELBLANK and DELNonNum functions. We won’t demonstrate this tool here, but see Data Conversion and Reformatting for more information about how to use that tool.
Example 2: Repeat Example 1 using the Reformatting a Data Range by Rows data analysis tool.
To use this data analysis tool press Ctrl-m and choose the Reformatting a Data Range by Rows option. A dialog box will appear as in Figure 2. Fill in the dialog box as indicated and click on OK. The exact same output will appear as we saw previously (namely range I3:O22 of Figure 1).

Figure 2 – Dialog box for Reformat Data Range by Rows
The data analysis tool will output the same number of rows as in the input data range, but any extra rows would be filled in with the values #N/A. Since four rows had at least one empty cell, four rows are deleted from the output (those for Arkansas, Colorado, Idaho and Indiana) and so the last four rows of the output need to be filled with #N/A.
Actually all the cells in the output range I3:O22 will contain the array formula =DELROWBLANK(A3:G22,TRUE) and so if we change the value of cell B15 to say 10.2, the row for Idaho would now automatically appear in the output and there would be one less row with values #N/A.
If we had entered an asterisk in the Filler field of Figure 2, then the output would be the same as we saw in Figure 1 except that this time all the cells in range I19:O22 would contain an asterisk instead of #N/A.
If we had entered the number 0 in the Filler field then all the cells in the output range would contain the array formula
=DELROWBLANK(A3:G22,True,””)
although the values of all the cells in the range I19:O22 would be empty. As before if we change the contents of cell B15 to 10.2, then the row for Idaho would appear in the output and only three rows with empty cells would appear. All the cells in the output range would still have the same array formula, namely
=DELROWBLANK(A3:G22,TRUE,””)
If we had checked the Freeze output range size element then the data analysis tool would determine that four rows have missing data and so it would output a range with four fewer rows, namely the range I3:O18. Although the output would be displayed exactly as in the case described in the previous paragraph, this time only the range I3:O18 would contain the formula =DELROWBLANK(A3:G22,TRUE). This time if cell B15 is changed to 10.2, then Idaho would be added to the output range, but since the output range only goes down to row 18, the last input row (that for Maine) would not be displayed, which is probably not what we want.
In conclusion, the Freeze output range size option makes the output cleaner (since all the rows contain data), but should not be used if there is the possibility that some missing data may be added later.
Imputing the values for missing data
Some techniques for imputing values for missing data include:
- Substituting the missing data with another observation which is considered similar, either taken from another sample or from a previous study
- Using the mean of all the non-missing data elements for that variable. This might be acceptable in cases with a small number of missing data elements, but otherwise, it can distort the distribution of the data (e.g. by reducing the variance) or by lowering the observed correlations (see Basic Concepts of Correlation).
- Using regression techniques. In this approach regression (as described in Regression and Multiple Regression) is used to predict the value of the missing data element based on the relationship between that variable and other variables. This approach reinforces existing relationships and so makes it more likely that the analysis will characterize the sample and not the general population.
Statistics for Beginners in Excel – Dealing with Missing Data
Disclaimer: The information and code presented within this recipe/tutorial is only for educational and coaching purposes for beginners and developers. Anyone can practice and apply the recipe/tutorial presented here, but the reader is taking full responsibility for his/her actions. The author (content curator) of this recipe (code / program) has made every effort to ensure the accuracy of the information was correct at time of publication. The author (content curator) does not assume and hereby disclaims any liability to any party for any loss, damage, or disruption caused by errors or omissions, whether such errors or omissions result from accident, negligence, or any other cause. The information presented here could also be found in public knowledge domains.
Learn by Coding: v-Tutorials on Applied Machine Learning and Data Science for Beginners
Latest end-to-end Learn by Coding Projects (Jupyter Notebooks) in Python and R:
All Notebooks in One Bundle: Data Science Recipes and Examples in Python & R.
End-to-End Python Machine Learning Recipes & Examples.
End-to-End R Machine Learning Recipes & Examples.
Applied Statistics with R for Beginners and Business Professionals
Data Science and Machine Learning Projects in Python: Tabular Data Analytics
Data Science and Machine Learning Projects in R: Tabular Data Analytics
Python Machine Learning & Data Science Recipes: Learn by Coding
R Machine Learning & Data Science Recipes: Learn by Coding
Comparing Different Machine Learning Algorithms in Python for Classification (FREE)
There are 2000+ End-to-End Python & R Notebooks are available to build Professional Portfolio as a Data Scientist and/or Machine Learning Specialist. All Notebooks are only $29.95. We would like to request you to have a look at the website for FREE the end-to-end notebooks, and then decide whether you would like to purchase or not.