
(R Tutorials for Business Analyst)
In this end-to-end example, you will find how we can replace missing values i.e. NA in R. NA can be appeared in the dataset when there is no particular value recorded for that particular field. It is important to replace such NA values in the dataset before starting any analysis.
How to Replace Missing Values(NA) in R
Missing values in data science arise when an observation is missing in a column of a data frame or contains a character value instead of numeric value. Missing values must be dropped or replaced in order to draw correct conclusion from the data.
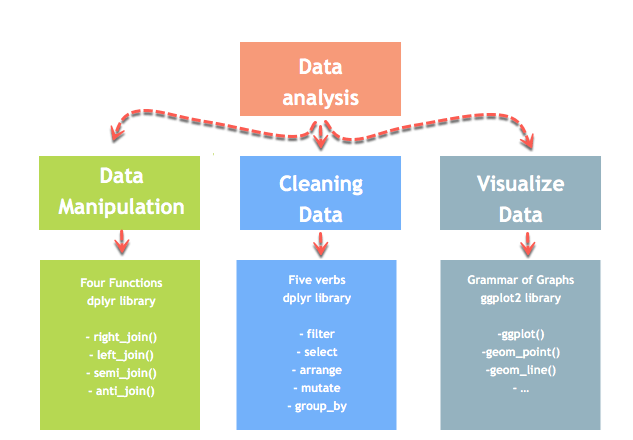
In this tutorial, we will learn how to deal with missing values with the dplyr library. dplyr library is part of an ecosystem to realize a data analysis.
In this tutorial, you will learn
- mutate()
- Exclude Missing Values (NA)
- Impute Missing Values (NA) with the Mean and Median
mutate()
The fourth verb in the dplyr library is helpful to create new variable or change the values of an existing variable.
We will proceed in two parts. We will learn how to:
- exclude missing values from a data frame
- impute missing values with the mean and median
The verb mutate() is very easy to use. We can create a new variable following this syntax:
mutate(df, name_variable_1 = condition, ...)
arguments:
-df: Data frame used to create a new variable
-name_variable_1: Name and the formula to create the new variable
-...: No limit constraint. Possibility to create more than one variable inside mutate()
Exclude Missing Values (NA)
The na.omit() method from the dplyr library is a simple way to exclude missing observation. Dropping all the NA from the data is easy but it does not mean it is the most elegant solution. During analysis, it is wise to use variety of methods to deal with missing values
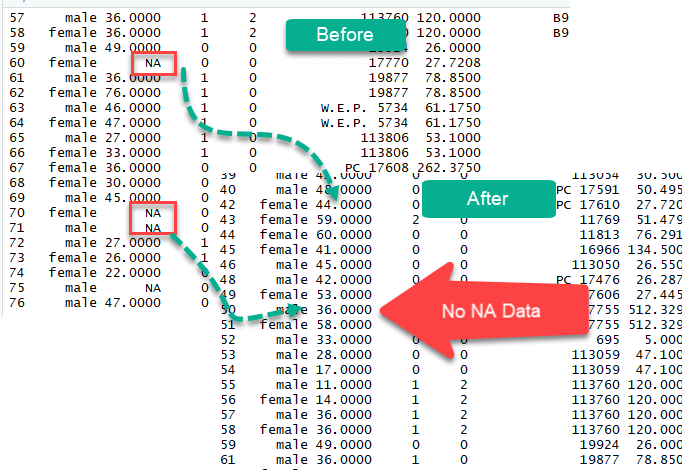
To tackle the problem of missing observations, we will use the titanic dataset. In this dataset, we have access to the information of the passengers on board during the tragedy. This dataset has many NA that need to be taken care of.
We will upload the csv file from the internet and then check which columns have NA. To return the columns with missing data, we can use the following code:
Let’s upload the data and verify the missing data.
PATH <- "/datafolder/test.csv"
df_titanic <- read.csv(PATH, sep = ",")
# Return the column names containing missing observations
list_na <- colnames(df_titanic)[ apply(df_titanic, 2, anyNA) ]
list_na
Output:
## [1] "age" "fare"
Here,
colnames(df_titanic)[apply(df_titanic, 2, anyNA)]
Gives the name of columns that do not have data.
The columns age and fare have missing values.
We can drop them with the na.omit().
library(dplyr)
# Exclude the missing observations
df_titanic_drop <-df_titanic %>%
na.omit()
dim(df_titanic_drop)
Output:
## [1] 1045 13
The new dataset contains 1045 rows compared to 1309 with the original dataset.
Impute Missing data with the Mean and Median
We could also impute(populate) missing values with the median or the mean. A good practice is to create two separate variables for the mean and the median. Once created, we can replace the missing values with the newly formed variables.
We will use the apply method to compute the mean of the column with NA. Let’s see an example
Step 1) Earlier in the tutorial, we stored the columns name with the missing values in the list called list_na. We will use this list
Step 2) Now we need to compute of the mean with the argument na.rm = TRUE. This argument is compulsory because the columns have missing data, and this tells R to ignore them.
# Create mean
average_missing <- apply(df_titanic[,colnames(df_titanic) %in% list_na],
      2,
      mean,
      na.rm =  TRUE)
average_missing
Code Explanation:
We pass 4 arguments in the apply method.
- df: df_titanic[,colnames(df_titanic) %in% list_na]. This code will return the columns name from the list_na object (i.e. “age” and “fare”)
- 2: Compute the function on the columns
- mean: Compute the mean
- na.rm = TRUE: Ignore the missing values
Output:
##      age     fare
## 29.88113 33.29548
We successfully created the mean of the columns containing missing observations. These two values will be used to replace the missing observations.
Step 3) Replace the NA Values
The verb mutate from the dplyr library is useful in creating a new variable. We don’t necessarily want to change the original column so we can create a new variable without the NA. mutate is easy to use, we just choose a variable name and define how to create this variable. Here is the complete code
# Create a new variable with the mean and median
df_titanic_replace <- df_titanic %>%
   mutate(replace_mean_age  = ifelse(is.na(age), average_missing[1], age),
   replace_mean_fare = ifelse(is.na(fare), average_missing[2], fare))
Code Explanation:
We create two variables, replace_mean_age and replace_mean_fare as follow:
- replace_mean_age = ifelse(is.na(age), average_missing[1], age)
- replace_mean_fare = ifelse(is.na(fare), average_missing[2],fare)
If the column age has missing values, then replace with the first element of average_missing (mean of age), else keep the original values. Same logic for fare
sum(is.na(df_titanic_replace$age))
Output:
## [1] 263
Perform the replacement
sum(is.na(df_titanic_replace$replace_mean_age))
Output:
## [1] 0
The original column age has 263 missing values while the newly created variable have replaced them with the mean of the variable age.
Step 4) We can replace the missing observations with the median as well.
median_missing <- apply(df_titanic[,colnames(df_titanic) %in% list_na],
      2,
      median,
      na.rm =  TRUE)
df_titanic_replace <- df_titanic %>%
            mutate(replace_median_age  = ifelse(is.na(age), median_missing[1], age),
            replace_median_fare = ifelse(is.na(fare), median_missing[2], fare))
head(df_titanic_replace)
Output:

Step 5) A big data set could have lots of missing values and the above method could be cumbersome. We can execute all the above steps above in one line of code using sapply() method. Though we would not know the vales of mean and median.
sapply does not create a data frame, so we can wrap the sapply() function within data.frame() to create a data frame object.
# Quick code to replace missing values with the mean
df_titanic_impute_mean < -data.frame(
    sapply(
        df_titanic,
        function(x) ifelse(is.na(x),
            mean(x, na.rm = TRUE),
            x)))
Summary
We have three methods to deal with missing values:
- Exclude all of the missing observations
- Impute with the mean
- Impute with the median
The following table summarizes how to remove all the missing observations
| Library | Objective | Code |
|---|---|---|
| base | List missing observations |
colnames(df)[apply(df, 2, anyNA)] |
| dplyr | Remove all missing values |
na.omit(df) |
Imputation with mean or median can be done in two ways
- Using apply
- Using sapply
| Method | Details | Advantages | Disadvantages |
|---|---|---|---|
| Step by step with apply | Check columns with missing, compute mean/median, store the value, replace with mutate() | You know the value of means/median | More execution time. Can be slow with big dataset |
| Quick way with sapply | Use sapply() and data.frame() to automatically search and replace missing values with mean/median | Short code and fast | Don’t know the imputation values |
Disclaimer: The information and code presented within this recipe/tutorial is only for educational and coaching purposes for beginners and developers. Anyone can practice and apply the recipe/tutorial presented here, but the reader is taking full responsibility for his/her actions. The author (content curator) of this recipe (code / program) has made every effort to ensure the accuracy of the information was correct at time of publication. The author (content curator) does not assume and hereby disclaims any liability to any party for any loss, damage, or disruption caused by errors or omissions, whether such errors or omissions result from accident, negligence, or any other cause. The information presented here could also be found in public knowledge domains.
Learn by Coding: v-Tutorials on Applied Machine Learning and Data Science for Beginners
Latest end-to-end Learn by Coding Projects (Jupyter Notebooks) in Python and R:
All Notebooks in One Bundle: Data Science Recipes and Examples in Python & R.
End-to-End Python Machine Learning Recipes & Examples.
End-to-End R Machine Learning Recipes & Examples.
Applied Statistics with R for Beginners and Business Professionals
Data Science and Machine Learning Projects in Python: Tabular Data Analytics
Data Science and Machine Learning Projects in R: Tabular Data Analytics
Python Machine Learning & Data Science Recipes: Learn by Coding
R Machine Learning & Data Science Recipes: Learn by Coding
Comparing Different Machine Learning Algorithms in Python for Classification (FREE)
There are 2000+ End-to-End Python & R Notebooks are available to build Professional Portfolio as a Data Scientist and/or Machine Learning Specialist. All Notebooks are only $29.95. We would like to request you to have a look at the website for FREE the end-to-end notebooks, and then decide whether you would like to purchase or not.
R tutorials for Business Analyst – Functions in R Programming
Python Example – Write a Python program to find a missing number from a list
Python Example – Write a Python program to find the median among three given numbers