Personal Career & Learning Guide for Data Analyst, Data Engineer and Data Scientist
QlikView is a powerful business intelligence and data visualization tool that is widely used by data analysts around the world. It provides a user-friendly interface that enables data analysts to access, analyze, and present data in a clear and effective manner. With QlikView, data analysts can quickly uncover valuable insights and make informed decisions based on their findings.
Here’s a brief introduction to QlikView and its key features:
Data Integration: QlikView can integrate data from a wide variety of sources, including databases, spreadsheets, and cloud-based platforms. This makes it easy for data analysts to access all of their data in one place, without having to manually import data from multiple sources.
Data Analysis: QlikView provides a wide range of data analysis tools, including interactive dashboards, pivot tables, and drill-down capabilities. With these tools, data analysts can easily explore their data, identify trends, and make informed decisions based on their findings.
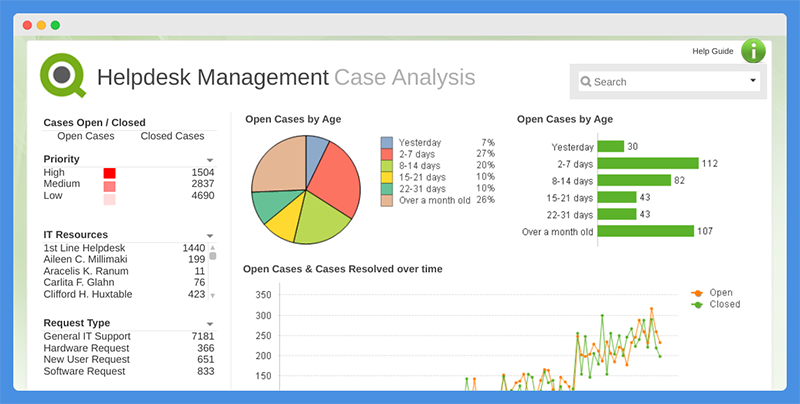
Data Visualization: QlikView’s intuitive data visualization features make it easy for data analysts to present their findings in a clear and effective manner. With a wide range of charts, graphs, and maps, data analysts can communicate their insights to stakeholders in a way that is easy to understand.
Collaboration: QlikView provides a collaborative platform that enables data analysts to share their findings with others, either within their organization or with external stakeholders. With QlikView, data analysts can work together to uncover new insights and make better decisions.
In conclusion, QlikView is a powerful tool for data analysts who are looking to access, analyze, and present data in a clear and effective manner. Whether you’re working with large amounts of data or just a small dataset, QlikView provides a wide range of data analysis and visualization tools that will help you uncover valuable insights and make informed decisions based on your findings.
QlikView for Data Analyst – QlikView Starter Guide – Part 01
 Loading...
Latest end-to-end Learn by Coding Projects (Jupyter Notebooks) in Python and R:
All Notebooks in One Bundle: Data Science Recipes and Examples in Python & R.
End-to-End Python Machine Learning Recipes & Examples.
End-to-End R Machine Learning Recipes & Examples.
Applied Statistics with R for Beginners and Business Professionals
Data Science and Machine Learning Projects in Python: Tabular Data Analytics
Data Science and Machine Learning Projects in R: Tabular Data Analytics
Python Machine Learning & Data Science Recipes: Learn by Coding
R Machine Learning & Data Science Recipes: Learn by Coding
Comparing Different Machine Learning Algorithms in Python for Classification (FREE)
There are 2000+ End-to-End Python & R Notebooks are available to build Professional Portfolio as a Data Scientist and/or Machine Learning Specialist. All Notebooks are only $29.95. We would like to request you to have a look at the website for FREE the end-to-end notebooks, and then decide whether you would like to purchase or not.