Personal Career & Learning Guide for Data Analyst, Data Engineer and Data Scientist
As a data analyst, you need to be familiar with a variety of data analysis techniques and tools to effectively analyze data. One of these tools is aggregate functions in QlikView. In this article, we’ll take a closer look at aggregate functions, what they are, and why they’re so important for data analysts.
What are Aggregate Functions in QlikView?
Aggregate functions in QlikView are functions that allow you to perform calculations on data in a set or group. These functions are used to summarize data, and they allow you to see patterns and trends in your data. Some of the most common aggregate functions in QlikView include SUM, AVG, MIN, MAX, and COUNT.
Why are Aggregate Functions Important for Data Analysts?
Aggregate functions are important for data analysts because they allow you to quickly and easily summarize data. This is useful when you have large datasets, and you want to see patterns and trends in your data without having to go through the data in detail.
Aggregate functions also make it easier to analyze data over time. For example, if you have a dataset with sales data over time, you can use aggregate functions to see trends in sales over time. This makes it easier to make decisions based on the data, and to see how your business is performing over time.
How to Use Aggregate Functions in QlikView?
To use aggregate functions in QlikView, you need to use the QlikView Desktop. This is a graphical user interface that allows you to create, edit, and manage your QlikView documents.
To use aggregate functions, you simply need to write a formula that includes the aggregate function you want to use. For example, if you want to see the sum of sales amounts, you can write a formula like “SUM(SalesAmount)”.
You can also use aggregate functions in combination with other functions, such as IntervalMatch. For example, if you want to see the sum of sales amounts for a specific date range, you can write a formula like “SUM(IF(OrderDate >= ’01/01/2022′ AND OrderDate <= ’12/31/2022′, SalesAmount))”.
Conclusion
In conclusion, aggregate functions are an important tool for data analysts using QlikView. They allow you to quickly and easily summarize data, and they make it easier to analyze data over time. Understanding how to use aggregate functions in QlikView is an important part of becoming a successful data analyst. Whether you’re a beginner or an experienced data analyst, taking the time to learn about aggregate functions and how to use them in QlikView will help you to become more efficient and effective in your data analysis tasks.
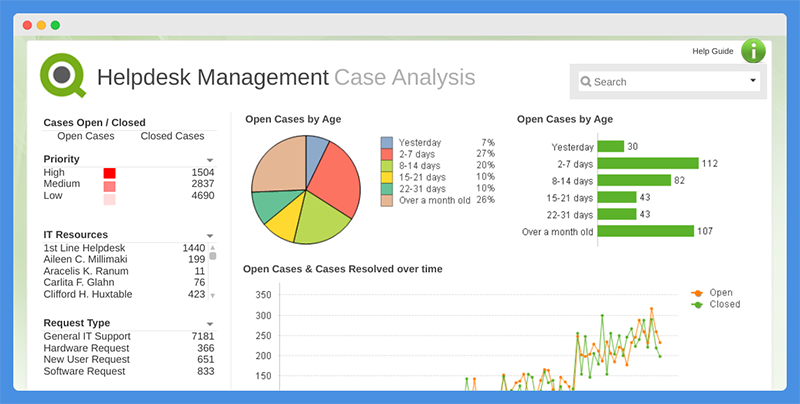
QlikView for Data Analyst – QlikView – Aggregate Functions
 Loading...
Latest end-to-end Learn by Coding Projects (Jupyter Notebooks) in Python and R:
All Notebooks in One Bundle: Data Science Recipes and Examples in Python & R.
End-to-End Python Machine Learning Recipes & Examples.
End-to-End R Machine Learning Recipes & Examples.
Applied Statistics with R for Beginners and Business Professionals
Data Science and Machine Learning Projects in Python: Tabular Data Analytics
Data Science and Machine Learning Projects in R: Tabular Data Analytics
Python Machine Learning & Data Science Recipes: Learn by Coding
R Machine Learning & Data Science Recipes: Learn by Coding
Comparing Different Machine Learning Algorithms in Python for Classification (FREE)
There are 2000+ End-to-End Python & R Notebooks are available to build Professional Portfolio as a Data Scientist and/or Machine Learning Specialist. All Notebooks are only $29.95. We would like to request you to have a look at the website for FREE the end-to-end notebooks, and then decide whether you would like to purchase or not.