Introduction: Understanding Logistic Regression and Its Applications
Logistic Regression is a fundamental statistical method used for binary classification in machine learning and data analysis. It is particularly useful for predicting the probability of an outcome based on a set of input features, making it a powerful tool for applications such as credit scoring, medical diagnosis, and customer churn prediction. In this extensive article, we will delve into the fundamentals of logistic regression, its implementation in the R programming language, and practical tips for improving model performance.
1. The Basics of Logistic Regression
1.1 What is Logistic Regression?
Logistic Regression is a type of regression analysis used to predict binary outcomes based on one or more input variables. Unlike linear regression, which predicts a continuous value, logistic regression predicts the probability of an outcome belonging to a specific class, such as ‘yes’ or ‘no’, ‘1’ or ‘0’, or ‘success’ or ‘failure’.
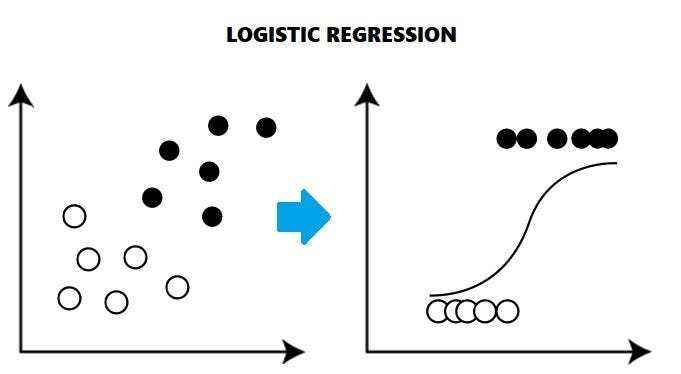
1.2 The Logistic Function
The logistic function, also known as the sigmoid function, is the core of logistic regression. It is an S-shaped curve that transforms any input value into a probability between 0 and 1. The logistic function is defined as:
P(Y=1|X) = 1 / (1 + exp(-z))
where z is a linear combination of input features (X) and their corresponding weights (W), represented by the equation:
z = W0 + W1 * X1 + W2 * X2 + … + Wn * Xn
The goal of logistic regression is to estimate the weights (W) that maximize the likelihood of observing the given data.
2. Implementing Logistic Regression in R
2.1 Loading the Data and Libraries
Begin by loading the necessary libraries and data into your R environment. For this tutorial, we will use the ‘glm’ (generalized linear model) function in R, which supports logistic regression through the ‘binomial’ family specification.
# Load libraries
library(dplyr)
library(ggplot2)
# Load data
data <- read.csv(“your_data.csv”)
2.2 Data Exploration and Preprocessing
Before training the logistic regression model, it is essential to explore and preprocess the data. This may involve checking for missing values, outliers, and correlations between input features. Additionally, categorical variables should be converted into dummy variables to ensure a proper model fit.
# Check for missing values
sum(is.na(data))
# Convert categorical variables to dummy variables
data <- model.matrix(~ . — 1, data)
2.3 Train-Test Split
Divide the data into a training set and a testing set to evaluate the model’s performance on unseen data.
# Train-test split
set.seed(123)
train_index <- sample(1:nrow(data), 0.8 * nrow(data))

train_data <- data[train_index, ]
test_data <- data[-train_index, ]
2.4 Model Training
Train the logistic regression model using the ‘glm’ function, specifying the ‘binomial’ family to indicate that we are performing logistic regression.
# Train logistic regression model
model <- glm(your_target_variable ~ ., data = train_data, family = binomial(link = “logit”))
3. Model Evaluation and Interpretation
3.1 Model Summary and Coefficients
Examine the model summary and coefficients to assess the significance of each input feature and understand their relationship with the outcome variable.
# Model summary
summary(model)
# Model coefficients
coef(model)
3.2 Model Performance Metrics
Evaluate the model’s performance using metrics such as accuracy, precision, recall, and F1-score, as well as the confusion matrix and Receiver Operating Characteristic (ROC) curve.
# Make predictions on the test data
predictions <- predict(model, newdata = test_data, type = “response”)
# Convert probabilities to binary predictions
binary_predictions <- ifelse(predictions > 0.5, 1, 0)
# Calculate accuracy
accuracy <- mean(binary_predictions == test_data$your_target_variable)
# Load the ‘caret’ library for additional performance metrics
library(caret)
# Confusion matrix
confusion_matrix <- confusionMatrix(as.factor(binary_predictions), as.factor(test_data$your_target_variable))
# Precision, recall, and F1-score
precision <- confusion_matrix$byClass[“Pos Pred Value”]
recall <- confusion_matrix$byClass[“Sensitivity”]
f1_score <- 2 * (precision * recall) / (precision + recall)
# ROC curve and AUC
library(pROC)
roc_obj <- roc(test_data$your_target_variable, predictions)
auc <- auc(roc_obj)
plot(roc_obj, main = paste(“AUC =”, round(auc, 2)))
4. Improving Model Performance
Several techniques can help improve the performance of your logistic regression model, including feature selection, handling class imbalance, and hyperparameter tuning.
4.1 Feature Selection
Feature selection is the process of identifying the most relevant input features for your model. By removing redundant or irrelevant features, you can reduce noise, improve model interpretability, and potentially enhance the model’s performance. Techniques such as Recursive Feature Elimination (RFE) and LASSO regularization can be used for feature selection in R.
4.2 Handling Class Imbalance
Class imbalance occurs when one class has significantly more examples than the other. This can lead to biased model predictions and poor performance. Techniques such as oversampling, undersampling, and Synthetic Minority Over-sampling Technique (SMOTE) can help address class imbalance in your data.
4.3 Hyperparameter Tuning
Tuning hyperparameters, such as regularization strength, can help optimize your logistic regression model’s performance. Consider using techniques such as grid search or random search to systematically explore different hyperparameter values and identify the best combination for your model.
Summary
By following the steps outlined in this comprehensive beginner’s guide, you can effectively implement and optimize logistic regression models in R for various binary classification tasks. From understanding the fundamentals of logistic regression and its implementation in R to evaluating model performance and applying techniques for improvement, this guide provides a solid foundation for harnessing the power of logistic regression in your data analysis projects.
Find more … …
Machine Learning Project – Logistic Regression in Machine Learning with Python
Statistics with R for Business Analysts – Logistic Regression
Classification in R – logistic regression for binary class classification in R