Introduction
In the world of data analysis and statistics, outliers are observations that deviate significantly from other observations. They’re unusual values in the dataset that can potentially cause serious problems in statistical analyses. Recognizing and appropriately managing outliers is a crucial part of data analysis and preparation, as they can skew statistical measures and impair the performance of machine learning algorithms. This comprehensive guide will provide an exhaustive understanding of outliers, how to identify them, and the techniques to manage them effectively in your data.
Understanding Outliers
Outliers are data points that differ significantly from the majority of the data. They can be the result of a mistake during data collection or they can be an actual data point that is a valid part of the dataset but is far from the other data points.
Outliers can be broadly categorized into two types:
1. Univariate Outliers: These are extreme values in a single variable or feature. These are the simplest to detect as you only have to consider a single dimension.
2. Multivariate Outliers: These are a combination of unusual scores on at least two variables. Identifying multivariate outliers is more complicated than spotting univariate outliers as you have to consider multiple dimensions.
Outliers can greatly skew the data, leading to incorrect or misleading representations and interpretations, which can have significant impacts on the conclusions drawn from the data. Therefore, they need to be identified and handled appropriately.
How to Identify Outliers
Outliers can be identified through various methods, each with its own advantages and drawbacks. Here are some commonly used techniques:
1. Statistical Methods
Standard Deviation: If the data follows a Gaussian or Gaussian-like distribution, you can use standard deviation to identify outliers. In a normal distribution, most data falls within three standard deviations of the mean. Any data point that lies more than three standard deviations from the mean can be considered an outlier.
Interquartile Range (IQR): For a non-Gaussian or skewed distribution, the Interquartile Range (IQR) can be used to identify outliers. The IQR is the range between the first quartile (25th percentile) and the third quartile (75th percentile). Any data points that fall below Q1–1.5 IQR or above Q3 + 1.5 IQR can be considered outliers.
2. Visualization Tools
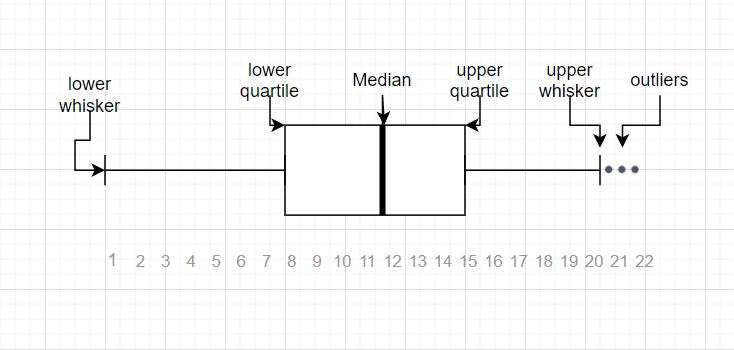
Box and Whisker Plots (Box Plots): A Box Plot is a graphical representation of statistical data based on a five-number summary (minimum, first quartile, median, third quartile, and maximum). In a box plot, a box is created from the first quartile to the third quartile, a vertical line is also there which goes through the box at the median. Here whiskers are drawn from both ends of the box to indicate variability outside the upper and lower quartiles, hence the plot is also termed as the box-and-whisker plot and box-and-whisker diagram. Outliers in box plots are indicated as individual points that are located above or below the whiskers.
Scatter Plots: Scatter plots are used for visualizing two-dimensional graphics that uses dots to represent the values obtained for two different variables — one plotted along the x-axis and the other plotted along the y-axis. Scatter plots are used when you want to show the relationship between two variables. Scatter plots are sometimes called correlation plots because they show how two variables are correlated.
How to Handle Outliers
After identifying the outliers, the next step is to handle them appropriately. The method used to handle outliers depends on the nature of the data and the reason for the outliers’ existence.
Deletion: Outliers can be deleted from the dataset. This is often appropriate for outliers caused by errors in data collection or recording.
Imputation: For outliers that are expected as part of the distribution of the data, imputation can be used. This involves replacing the outlier with a new value, such as the mean or median of the data.
Capping: Outliers can also be capped at a particular maximum and/or minimum value. This method retains the “outlierness” of the data point but reduces the impact on statistical analysis.
Transforming: This involves applying a mathematical operation such as log, square root, or inverse to the data. This can reduce the impact of the outliers.
Conclusion
In conclusion, outliers, while challenging, can be effectively managed by following the right identification and handling techniques. Through statistical methods, data visualization tools, and appropriate handling methods, you can ensure that your data is robust and reliable, leading to more accurate statistical analyses and better-performing machine learning models. Always remember, understanding your data is the key to deciding how to handle outliers, and not all outliers are bad or need to be removed. It’s all about understanding the nature and source of these anomalies. This comprehensive guide provides a strong foundation for identifying and handling outliers in your data.
Find more … …
A Comprehensive Guide to Summarizing Data: 7 Essential Techniques to Derive Meaningful Insights
Statistics for Beginners in Excel – Identifying Outliers and Missing Data using Real Statistics