Feature Scaling – Part 2
Feature Scaling is a technique to standardize the independent features present in the data in a fixed range. It is performed during the data pre-processing to handle highly varying magnitudes or values or units. If feature scaling is not done, then a machine learning algorithm tends to weigh greater values, higher and consider smaller values as the lower values, regardless of the unit of the values.
Example: If an algorithm is not using feature scaling method then it can consider the value 3000 meter to be greater than 5 km but that’s actually not true and in this case, the algorithm will give wrong predictions. So, we use Feature Scaling to bring all values to same magnitudes and thus, tackle this issue.
Techniques to perform Feature Scaling
Consider the two most important ones:
- Min-Max Normalization: This technique re-scales a feature or observation value with distribution value between 0 and 1.

- Standardization: It is a very effective technique which re-scales a feature value so that it has distribution with 0 mean value and variance equals to 1.

Download the dataset:
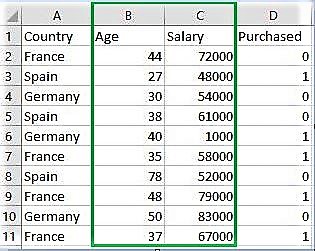
Go to the link and download Data_for_Feature_Scaling.csv

Below is the Python Code:
# Python code explaining How to # perform Feature Scaling """ PART 1 Importing Libraries """ import numpy as np import matplotlib.pyplot as plt import pandas as pd # Sklearn library from sklearn import preprocessing """ PART 2 Importing Data """ data_set = pd.read_csv('C:\Users\dell\Desktop\Data_for_Feature_Scaling.csv') data_set.head() # here Features - Age and Salary columns # are taken using slicing # to handle values with varying magnitude x = data_set.iloc[:, 1:3].values print ("nOriginal data values : n", x) """ PART 4 Handling the missing values """ from sklearn import preprocessing """ MIN MAX SCALER """ min_max_scaler = preprocessing.MinMaxScaler(feature_range =(0, 1)) # Scaled feature x_after_min_max_scaler = min_max_scaler.fit_transform(x) print ("nAfter min max Scaling : n", x_after_min_max_scaler) """ Standardisation """ Standardisation = preprocessing.StandardScaler() # Scaled feature x_after_Standardisation = Standardisation.fit_transform(x) print ("nAfter Standardisation : n", x_after_Standardisation) |
Output :
   Country  Age  Salary  Purchased
0   France   44   72000          0
1    Spain   27   48000          1
2  Germany   30   54000          0
3    Spain   38   61000          0
4  Germany   40    1000          1

Original data values :
 [[   44 72000]
 [   27 48000]
 [   30 54000]
 [   38 61000]
 [   40  1000]
 [   35 58000]
 [   78 52000]
 [   48 79000]
 [   50 83000]
 [   37 67000]]

After min max Scaling :
 [[ 0.33333333  0.86585366]
 [ 0.          0.57317073]
 [ 0.05882353  0.64634146]
 [ 0.21568627  0.73170732]
 [ 0.25490196  0.        ]
 [ 0.15686275  0.69512195]
 [ 1.          0.62195122]
 [ 0.41176471  0.95121951]
 [ 0.45098039  1.        ]
 [ 0.19607843  0.80487805]]

After Standardisation :
 [[ 0.09536935  0.66527061]
 [-1.15176827 -0.43586695]
 [-0.93168516 -0.16058256]
 [-0.34479687  0.16058256]
 [-0.1980748  -2.59226136]
 [-0.56487998  0.02294037]
 [ 2.58964459 -0.25234403]
 [ 0.38881349  0.98643574]
 [ 0.53553557  1.16995867]
 [-0.41815791  0.43586695]]
Python Example for Beginners
Two Machine Learning Fields
There are two sides to machine learning:
- Practical Machine Learning:This is about querying databases, cleaning data, writing scripts to transform data and gluing algorithm and libraries together and writing custom code to squeeze reliable answers from data to satisfy difficult and ill defined questions. It’s the mess of reality.
- Theoretical Machine Learning: This is about math and abstraction and idealized scenarios and limits and beauty and informing what is possible. It is a whole lot neater and cleaner and removed from the mess of reality.
Data Science Resources: Data Science Recipes and Applied Machine Learning Recipes
Introduction to Applied Machine Learning & Data Science for Beginners, Business Analysts, Students, Researchers and Freelancers with Python & R Codes @ Western Australian Center for Applied Machine Learning & Data Science (WACAMLDS) !!!
Latest end-to-end Learn by Coding Recipes in Project-Based Learning:
Applied Statistics with R for Beginners and Business Professionals
Data Science and Machine Learning Projects in Python: Tabular Data Analytics
Data Science and Machine Learning Projects in R: Tabular Data Analytics
Python Machine Learning & Data Science Recipes: Learn by Coding
R Machine Learning & Data Science Recipes: Learn by Coding
Comparing Different Machine Learning Algorithms in Python for Classification (FREE)
Disclaimer: The information and code presented within this recipe/tutorial is only for educational and coaching purposes for beginners and developers. Anyone can practice and apply the recipe/tutorial presented here, but the reader is taking full responsibility for his/her actions. The author (content curator) of this recipe (code / program) has made every effort to ensure the accuracy of the information was correct at time of publication. The author (content curator) does not assume and hereby disclaims any liability to any party for any loss, damage, or disruption caused by errors or omissions, whether such errors or omissions result from accident, negligence, or any other cause. The information presented here could also be found in public knowledge domains.
