Introduction
In the world of data warehousing, fact tables and dimension tables are two fundamental components that enable organizations to store, manage, and analyze their data efficiently. These tables serve distinct purposes, possess unique characteristics, and are used in conjunction to create a robust data model that supports efficient querying and reporting. In this comprehensive guide, we will explore the differences between fact tables and dimension tables, their roles in data warehousing, and how they interact to support data-driven decision-making.
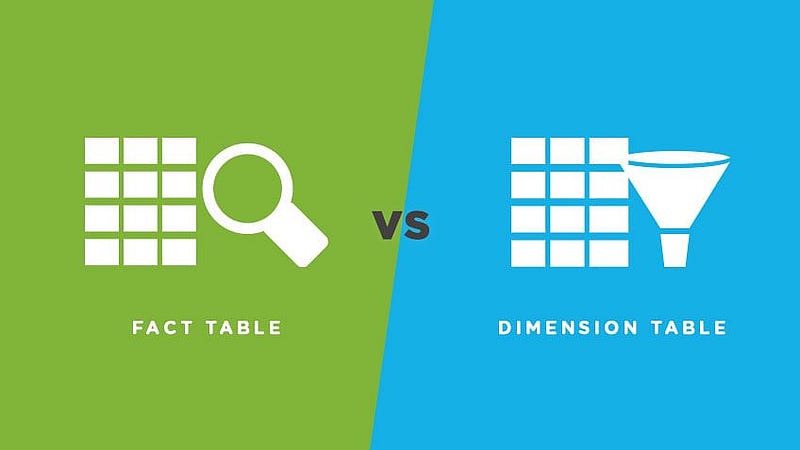
Fact Tables
Fact tables are the central tables in a data warehouse schema that store the quantitative data or measurements of a business process. They contain the key performance indicators (KPIs) or metrics that organizations use to analyze their operations and make data-driven decisions.
Characteristics of Fact Tables
Numerical data: Fact tables contain numerical data, such as sales revenue, order quantities, or product costs, that can be aggregated and analyzed.
Foreign key references: Fact tables include foreign key references to the associated dimension tables, which provide context for the quantitative data.
Granularity: Fact tables have a specific level of granularity, which refers to the level of detail of the data stored in the table. Granularity can range from fine-grained data, such as individual transactions, to coarse-grained data, such as monthly summaries.
Additive, semi-additive, or non-additive: The numerical data stored in fact tables can be additive, semi-additive, or non-additive. Additive measures can be summed across all dimensions, semi-additive measures can be summed across some dimensions, and non-additive measures cannot be summed across any dimensions.
Examples of Fact Tables
Sales fact table: This table stores data related to sales transactions, such as revenue, order quantity, and discounts. It includes foreign key references to dimension tables, such as customers, products, and time.
Inventory fact table: This table stores data related to inventory levels, such as stock quantities, unit costs, and reorder levels. It includes foreign key references to dimension tables, such as products, warehouses, and time.
Dimension Tables
Dimension tables provide the context or descriptive information for the quantitative data stored in fact tables. They store the attributes or characteristics that define the dimensions of a business process, such as customer demographics, product descriptions, or store locations.
Characteristics of Dimension Tables
Descriptive data: Dimension tables contain descriptive data, such as names, addresses, or categories, that provide context for the quantitative data in fact tables.
Primary key: Each dimension table has a primary key, which uniquely identifies each row in the table and serves as a foreign key reference in the associated fact table.
Hierarchical relationships: Dimension tables often include hierarchical relationships between attributes, allowing users to navigate and aggregate data at different levels of granularity.
Slowly changing dimensions: Dimension tables may include historical data and track changes over time using slowly changing dimension (SCD) techniques, such as Type 1, Type 2, or Type 3 updates.
Examples of Dimension Tables
Customer dimension table: This table stores data related to customers, such as customer ID, name, address, and demographic information. It provides context for the sales transactions stored in the sales fact table.
Product dimension table: This table stores data related to products, such as product ID, description, category, and brand. It provides context for the sales transactions and inventory levels stored in the sales and inventory fact tables.
Interplay Between Fact Tables and Dimension Tables
Fact tables and dimension tables work together to create a comprehensive data model that supports efficient querying, reporting, and analysis. They interact in the following ways:
Star schema: In a star schema, a central fact table is connected to one or more dimension tables through foreign key references. The fact table contains the quantitative data, while the dimension tables provide the context for this data. This schema allows for efficient querying and aggregation of data at various levels of granularity.
Snowflake schema: In a snowflake schema, dimension tables are normalized and split into multiple related tables to eliminate redundancy. The fact table still serves as the central table in the schema and connects to the primary dimension tables, which in turn connect to the secondary dimension tables. This schema requires more complex queries but can result in reduced storage and improved data integrity.
Querying and reporting: When users query the data warehouse, they typically join the fact table with one or more dimension tables to retrieve the desired quantitative data and its associated context. The hierarchical relationships within dimension tables enable users to aggregate and analyze data at different levels of granularity, providing insights into various aspects of their business operations.
ETL processes: Fact tables and dimension tables are populated and updated through Extract, Transform, Load (ETL) processes. These processes extract data from various source systems, transform it into the required format and structure, and load it into the fact and dimension tables in the data warehouse. ETL processes may also involve updating dimension tables using slowly changing dimension techniques to maintain historical data and track changes over time.
Summary
Fact tables and dimension tables are two essential components of data warehousing that enable organizations to store, manage, and analyze their data efficiently. Fact tables store the quantitative data or measurements of a business process, while dimension tables provide the context or descriptive information for this data. By understanding the roles, characteristics, and interplay between fact tables and dimension tables, organizations can design and implement robust data warehouse schemas that support efficient querying, reporting, and analysis, ultimately driving data-driven decision-making and business growth.