Free eBooks for Beginners
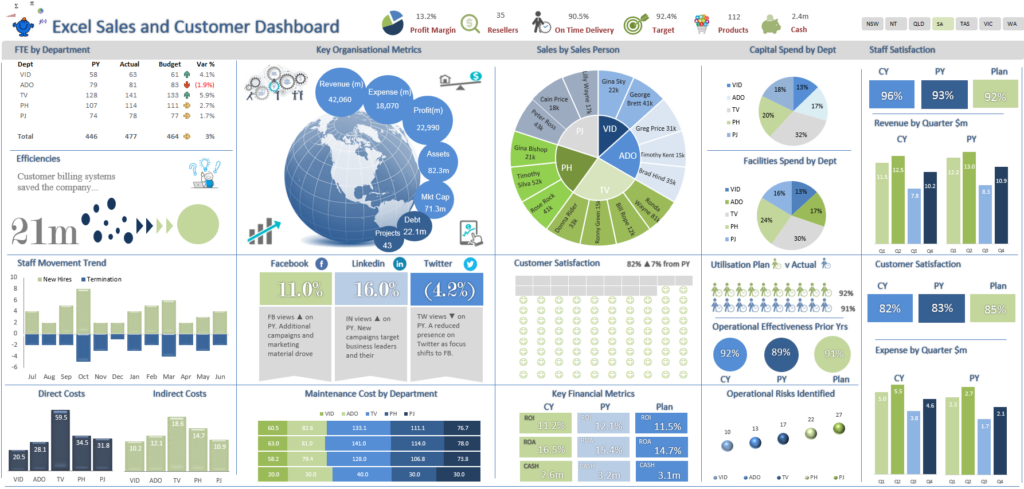
Excel dashboards are a tool that is commonly used by data analysts to provide a visual representation of data in a way that is easy to understand and analyze. A dashboard is essentially a collection of charts, tables, and other data visualizations that are organized on a single worksheet. The purpose of a dashboard is to allow you to quickly and easily see the most important information from your data, and to make informed decisions based on that information.
One of the key advantages of using Excel dashboards is that they are highly customizable. You can choose the type of charts, tables, and other visualizations that you want to include in your dashboard, and you can arrange them in a way that makes the most sense for your data. You can also format your dashboard to match your specific needs, such as changing the colors, font styles, and other visual elements.
Another advantage of using Excel dashboards is that they are easy to create and update. If you have experience with Excel, you will find that creating a dashboard is similar to creating any other worksheet. You can use Excel’s built-in charting tools to create your visualizations, and you can easily update your dashboard as your data changes. This makes it easy to keep your dashboard up-to-date and relevant, even as your data evolves over time.
In conclusion, Excel dashboards are a powerful tool for data analysts who want to provide a visual representation of their data in a way that is easy to understand and analyze. They are highly customizable, making it easy to create a dashboard that meets your specific needs, and they are easy to create and update, making it simple to keep your dashboard up-to-date and relevant. Whether you are a beginner or an experienced data analyst, using Excel dashboards is a must-have skill that will help you to be more effective and efficient in your work. By taking the time to learn how to create and customize Excel dashboards, you can gain a deeper understanding of your data and make better decisions based on your data.
Excel Dashboard for Beginner and Data Analyst : Tutorial 01
 Loading...
Disclaimer: The information and code presented within this recipe/tutorial is only for educational and coaching purposes for beginners and developers. Anyone can practice and apply the recipe/tutorial presented here, but the reader is taking full responsibility for his/her actions. The author (content curator) of this recipe (code / program) has made every effort to ensure the accuracy of the information was correct at time of publication. The author (content curator) does not assume and hereby disclaims any liability to any party for any loss, damage, or disruption caused by errors or omissions, whether such errors or omissions result from accident, negligence, or any other cause. The information presented here could also be found in public knowledge domains.