Introduction to Correlation in Data Analysis
Correlation is a fundamental concept in data analysis, used to measure the strength and direction of the relationship between two variables. Understanding, interpreting, and applying correlation is critical for making accurate predictions, identifying trends, and uncovering hidden relationships in data. This comprehensive guide delves into the various aspects of correlation, addressing common questions, misconceptions, and best practices to help you navigate the world of correlation in data analysis.
1. Understanding the Basics of Correlation
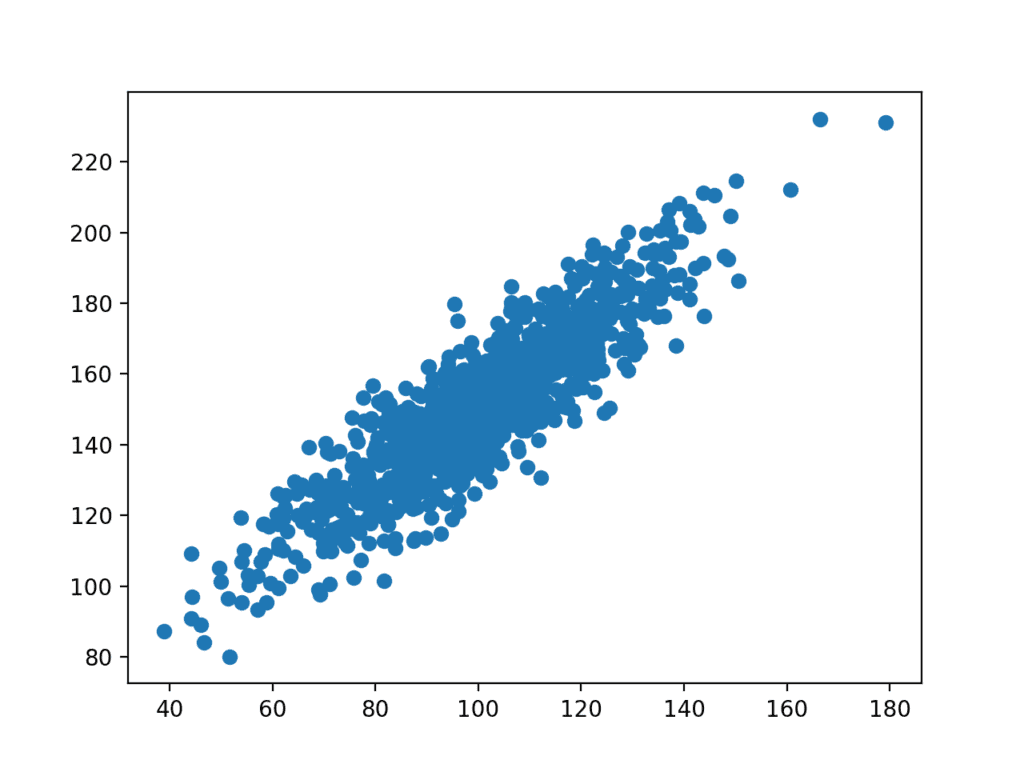
Correlation measures the degree to which two variables move together, providing insights into the relationship between them. The most common measure of correlation is the Pearson correlation coefficient (r), which ranges from -1 to 1.
a. Positive Correlation: When r is positive, it indicates that as one variable increases, the other variable also increases.
b. Negative Correlation: When r is negative, it indicates that as one variable increases, the other variable decreases.
c. No Correlation: When r is close to zero, it indicates that there is no linear relationship between the two variables.
2. Common Misconceptions About Correlation
a. Correlation Implies Causation: A common misconception is that correlation implies causation. While correlation can provide evidence of a relationship between two variables, it does not necessarily mean that one variable causes the other. Confounding variables, reverse causation, and chance may explain the observed correlation.
b. The Strength of Correlation Determines Causation: A strong correlation does not necessarily imply a causal relationship. It is essential to consider the context, underlying mechanisms, and potential confounding factors when interpreting correlations.
c. Correlation is Only Relevant for Linear Relationships: Pearson’s correlation coefficient measures linear relationships between variables. However, other correlation measures, such as Spearman’s rank correlation coefficient and Kendall’s tau, can capture non-linear relationships.
3. Calculating Correlation in Data Analysis
Various tools and techniques are available for calculating correlation in data analysis:
a. Excel: Use the CORREL function in Excel to calculate the Pearson correlation coefficient between two variables.
b. R Programming: Use the cor() function in R to calculate the correlation coefficient between two variables. For non-linear correlations, use the spearman or kendall methods with the cor() function.
c. Python: Use the numpy.corrcoef() function or the pandas.DataFrame.corr() method in Python to calculate the correlation coefficient between two variables.
4. Interpreting Correlation Coefficients
When interpreting correlation coefficients, consider the following factors:
a. Strength: The strength of the correlation is determined by the absolute value of the correlation coefficient. Larger absolute values indicate stronger relationships.
b. Direction: The direction of the correlation is indicated by the sign of the correlation coefficient. Positive values signify positive correlations, while negative values signify negative correlations.
c. Context: Interpret the correlation coefficient in the context of the variables, the underlying mechanisms, and the potential confounding factors.
5. Limitations of Correlation Analysis
a. Outliers: Outliers can have a significant impact on the correlation coefficient, leading to distorted results. Identify and address outliers before calculating correlation coefficients.
b. Non-linear Relationships: Pearson’s correlation coefficient is sensitive to linear relationships only. Use other correlation measures, such as Spearman’s rank correlation coefficient and Kendall’s tau, for non-linear relationships.
c. Confounding Variables: Confounding variables can create spurious correlations, undermining the validity of the correlation analysis. Investigate potential confounding factors and adjust for them when necessary.
6. Applications of Correlation in Data Analysis
Correlation analysis is widely used in various domains, including:
a. Finance: In finance, correlation is used to analyze the relationships between different assets, such as stocks, bonds, and commodities. Understanding these relationships helps investors diversify their portfolios, manage risk, and make informed investment decisions.
b. Marketing: In marketing, correlation analysis can help identify relationships between different marketing channels, customer demographics, and consumer behavior patterns. This information can be used to optimize marketing strategies, allocate resources effectively, and target the right audience segments.
c. Healthcare: In healthcare, correlation analysis can be applied to study the relationships between various health factors, such as lifestyle, diet, and medical conditions. These insights can help inform public health policies, develop preventative measures, and identify potential risk factors for various diseases.
d. Social Sciences: In social sciences, correlation analysis is used to explore relationships between different social, economic, and political variables. This information can help researchers understand complex social phenomena, identify trends, and inform public policy.
7. Best Practices for Correlation Analysis
To ensure accurate and reliable results from your correlation analysis, follow these best practices:
a. Visualize Your Data: Use scatterplots and other visualization techniques to explore the relationships between variables before calculating correlation coefficients. This can help identify potential outliers, non-linear relationships, and other issues that may affect your analysis.
b. Choose the Appropriate Correlation Measure: Select the most appropriate correlation measure for your data, taking into account the nature of the variables and the type of relationship you are interested in exploring.
c. Control for Confounding Variables: Investigate potential confounding factors that may influence the relationship between your variables and adjust for them when necessary. This can help ensure that your correlation analysis is not driven by spurious relationships.
d. Interpret Results with Caution: Be cautious when interpreting correlation coefficients, and avoid making causal claims without rigorous evidence. Consider the context, underlying mechanisms, and potential confounding factors when interpreting your findings.
Conclusion
Correlation is a powerful tool in data analysis, providing insights into the relationships between variables and helping to identify trends, make predictions, and uncover hidden patterns in data. By understanding the basics of correlation, addressing common misconceptions, and following best practices for calculation, interpretation, and application, you can harness the full potential of correlation in your data analysis projects. As the demand for data-driven decision-making continues to grow across various sectors and disciplines, mastering correlation analysis will become an increasingly valuable skill for researchers, analysts, and professionals alike.
Find more … …
Correlation Matrix Plots | Jupyter Notebook | Python Data Science for beginners | Data Visualisation