GGPLOT TITLE, SUBTITLE AND CAPTION
This article describes how to add and change a main title, a subtitle and a caption to a graph generated using the ggplot2 R package. We’ll show also how to center the title position, as well as, how to change the title font size and color.
In this R graphics tutorial, you will learn how to:
- Add titles and subtitles by using either the function ggtitle() or labs().
- Add caption to a ggplot and change the position.
- Split a long title into two lines or more using n as a text separator.
- Change the font appearance (text size, color and face) of titles and caption. For example, to set a bold ggplot title, use this:
p + theme(plot.title = element_text(face = "bold")). The allowed values for the font face include: “plain”, “italic”, “bold” and “bold.italic”. - Change title position to the center or to any other locations (left, right). The default ggplot title alignment is not centered. It is on the left. It’s possible to put the title in the middle of the chart by specifying the argument
hjust = 0.5in the functionelement_text():p + theme(plot.title = element_text(hjust = 0.5)). The optionshjust = 1andhjust = 0place titles on the right and the left side of the plot, respectively.
Contents:
- Key ggplot2 R functions
- Add main title, subtitle and caption
- Change title and caption style: font size, color and face
- Center the title position
- Change caption position
- Conclusion
Key ggplot2 R functions
- Start by creating a box plot using the
ToothGrowthdata set:
library(ggplot2)
p <- ggplot(ToothGrowth, aes(x = factor(dose), y = len)) +
geom_boxplot()- Add titles using one of the following functions:
- p + ggtitle(“Main title”, subtitle = “My subtitle”)
- p + labs(title = “Main title”, subtitle = “My subtitle”, caption = “My caption”)
- Key ggplot2 theme options to change the font of titles and captions:
theme(
  plot.title = element_text(),
  plot.subtitle.title = element_text(),
  plot.caption = element_text()
)
Arguments of the function element_text() includes:
- color, size, face, family: to change the text font color, size, face (“plain”, “italic”, “bold”, “bold.italic”) and family.
- lineheight: change space between two lines of text elements. Number between 0 and 1. Useful for multi-line plot titles.
- hjust and vjust: number in [0, 1], for horizontal and vertical adjustment of titles, respectively.
hjust = 0.5: Center the plot titles.hjust = 1: Place the plot title on the righthjust = 0: Place the plot title on the left
Add main title, subtitle and caption
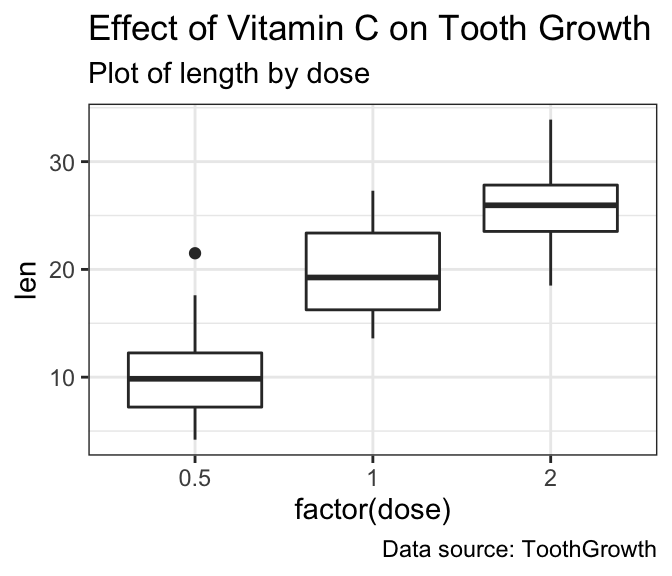
- Use the function
labs()
# Default plot
print(p)
# Add titles
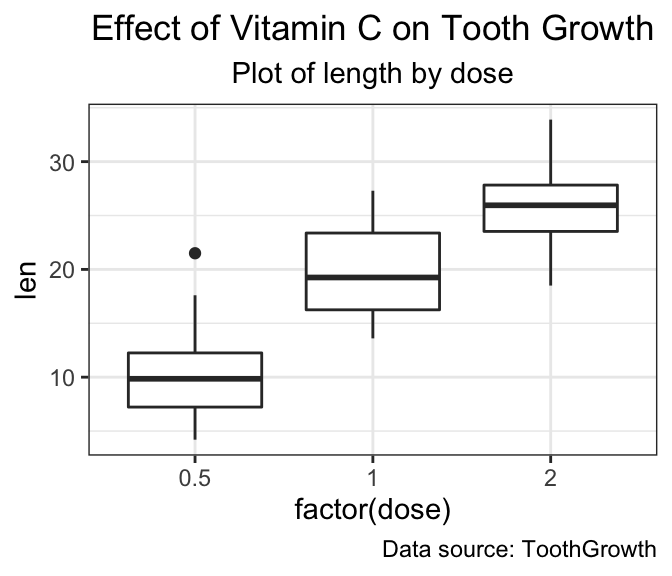
p <- p + labs(title = "Effect of Vitamin C on Tooth Growth",
subtitle = "Plot of length by dose",
caption = "Data source: ToothGrowth")
p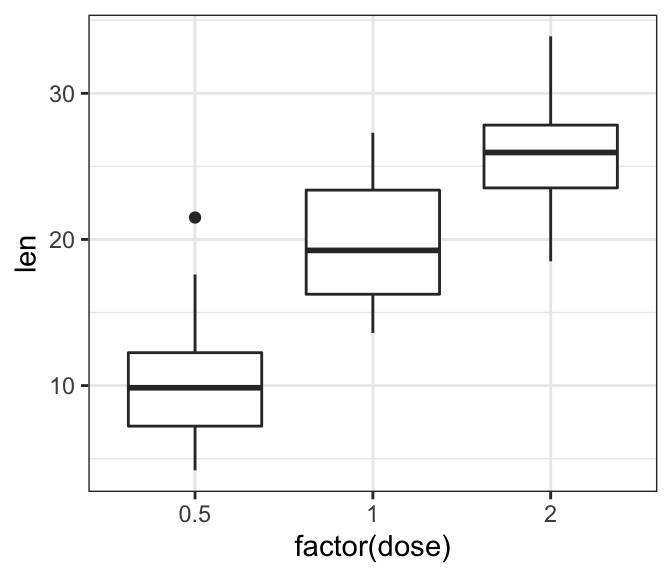
- Alternatively, you can use the function
ggtitle()as follow:
p + ggtitle(label = "Effect of Vitamin C on Tooth Growth",
              subtitle = "Plot of length by dose")
If the title is too long, you can split it into two or multiple lines using n. In this case you can adjust the space between text lines by specifying the argument lineheight in the theme function element_text():
p + labs(title = "Effect of Vitamin C on Tooth Growth n in Guinea Pigs")+
  theme(plot.title = element_text(lineheight = 0.9))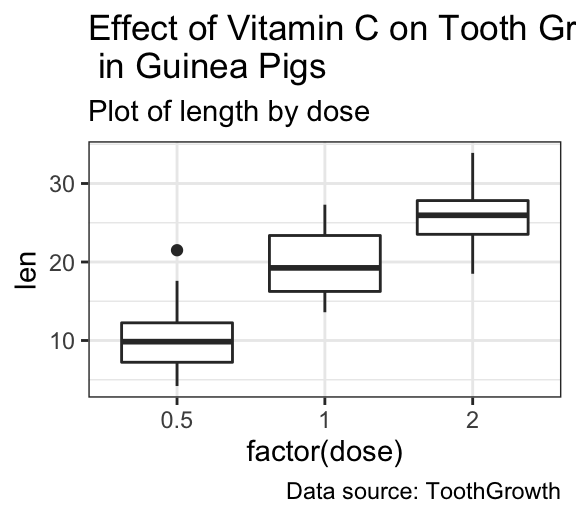
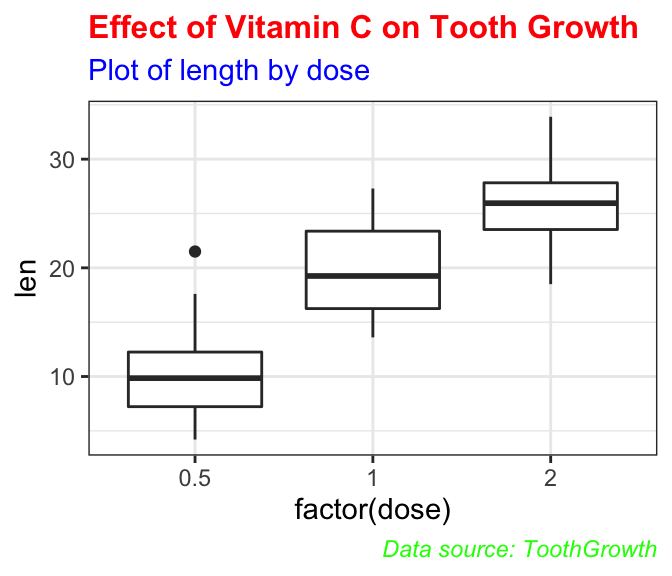
Change title and caption style: font size, color and face
- Key functions:
theme()andelement_text(color, size, face) - Allowed values for font face: “plain”, “italic”, “bold” and “bold.italic”
p + theme(
  plot.title = element_text(color = "red", size = 12, face = "bold"),
  plot.subtitle = element_text(color = "blue"),
  plot.caption = element_text(color = "green", face = "italic")
)
Center the title position
Specify the argument hjust = 0.5 in the function element_text() to put the title in the middle:
p + theme(
  plot.title = element_text(hjust = 0.5),
  plot.subtitle = element_text(hjust = 0.5)
)
Other locations adjustment for titles include:
hjust = 1: Place the title on the righthjust = 0: Place the title on the left
Change caption position
As for titles, you can modify the caption position using hjust. For example to place the caption on the plot left side, type this:
p + theme(
  plot.caption = element_text(hjust = 0)
  )
Conclusion
- Create an example of ggplot:
library(ggplot2)
p <- ggplot(ToothGrowth, aes(x = factor(dose), y = len)) +
geom_boxplot()- Add titles, subtitles and captions:
# Add titles and a caption
p + labs(title = "Effect of Vitamin C on Tooth Growth",
        subtitle = "Plot of length by dose",
        caption = "Data source: ToothGrowth")+
  theme(
    plot.title = element_text(hjust = 0.5, size = 14),    # Center title position and size
    plot.subtitle = element_text(hjust = 0.5),            # Center subtitle
    plot.caption = element_text(hjust = 0, face = "italic")# move caption to the left
  )
Python Example for Beginners

Two Machine Learning Fields
There are two sides to machine learning:
- Practical Machine Learning:This is about querying databases, cleaning data, writing scripts to transform data and gluing algorithm and libraries together and writing custom code to squeeze reliable answers from data to satisfy difficult and ill defined questions. It’s the mess of reality.
- Theoretical Machine Learning: This is about math and abstraction and idealized scenarios and limits and beauty and informing what is possible. It is a whole lot neater and cleaner and removed from the mess of reality.
Data Science Resources: Data Science Recipes and Applied Machine Learning Recipes
Introduction to Applied Machine Learning & Data Science for Beginners, Business Analysts, Students, Researchers and Freelancers with Python & R Codes @ Western Australian Center for Applied Machine Learning & Data Science (WACAMLDS) !!!
Latest end-to-end Learn by Coding Recipes in Project-Based Learning:
Applied Statistics with R for Beginners and Business Professionals
Data Science and Machine Learning Projects in Python: Tabular Data Analytics
Data Science and Machine Learning Projects in R: Tabular Data Analytics
Python Machine Learning & Data Science Recipes: Learn by Coding
R Machine Learning & Data Science Recipes: Learn by Coding
Comparing Different Machine Learning Algorithms in Python for Classification (FREE)
Disclaimer: The information and code presented within this recipe/tutorial is only for educational and coaching purposes for beginners and developers. Anyone can practice and apply the recipe/tutorial presented here, but the reader is taking full responsibility for his/her actions. The author (content curator) of this recipe (code / program) has made every effort to ensure the accuracy of the information was correct at time of publication. The author (content curator) does not assume and hereby disclaims any liability to any party for any loss, damage, or disruption caused by errors or omissions, whether such errors or omissions result from accident, negligence, or any other cause. The information presented here could also be found in public knowledge domains.