Data Analytics – GGPLOT THEMES GALLERY
In this R graphics tutorial, we present a gallery of ggplot themes.
You’ll learn how to:
- Change the default ggplot theme by using the list of the standard themes available in ggplot2 R package. Our selection of best ggplot themes for professional publications or presentations, include: theme_classic(), theme_minimal() and theme_bw(). Another famous theme is the dark theme: theme_dark().
- Use other helpful examples of ggplot2 themes available in the ggthemes R package. These include theme_tufte(), theme_economist() and theme_hc(). You’ll also see how to create a tufte minimalist boxplot.
- Modify, at once, all the theme text elements by specifying the ggplot base_size argument in the theme functions. Example:
p + theme_minimal(base_size = 18). - Change the theme for the entire session using theme_set(). For example, is you type
theme_set(theme_classic(base_size = 16))in the R console, then the classic theme will be automatically applied to every plot you draw. The theme_set() function completely override the current active theme. - Create your own custom theme.
Contents:
- Basic ggplot
- Change themes
- Use themes in ggplot2
- Use ggthemes
- theme_tufte
- theme_economist
- theme_stata
- theme_hc
- Override the current theme: theme_set
- Change ggplot theme base_size and base_family
- Create a custom theme
- Conclusion
Basic ggplot
Data: ToothGrowth
# Convert the column dose to factor variable
data("ToothGrowth")
ToothGrowth$dose <- as.factor(ToothGrowth$dose)

# Create a simple boxplot
library(ggplot2)
p <- ggplot(ToothGrowth, aes(x = dose, y = len)) +
  geom_boxplot()
Change themes
Use themes in ggplot2
Several simple functions are available in ggplot2 package to set easily a ggplot theme. These include:
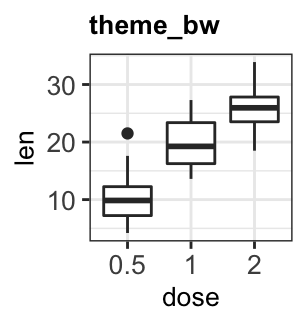
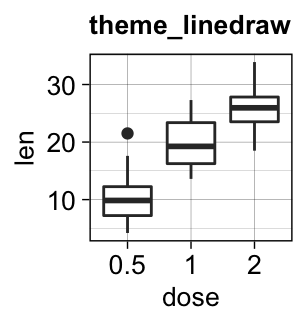
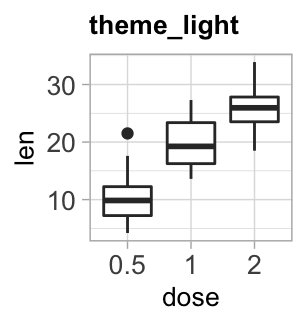
theme_gray(): Gray background color and white grid lines. Put the data forward to make comparisons easy.theme_bw(): White background and gray grid lines. May work better for presentations displayed with a projector.theme_linedraw(): A theme with black lines of various widths on white backgrounds, reminiscent of a line drawings.theme_light(): A theme similar totheme_linedraw()but with light grey lines and axes, to direct more attention towards the data.
p + theme_gray(base_size = 14)

p + theme_bw()

p + theme_linedraw()

p + theme_light()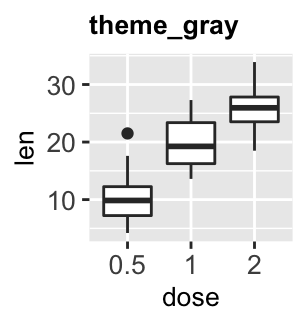
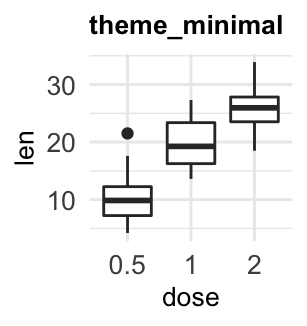
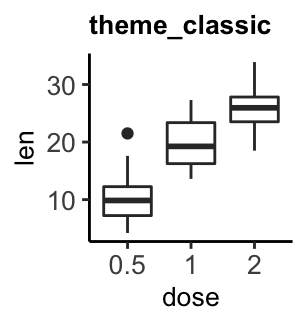
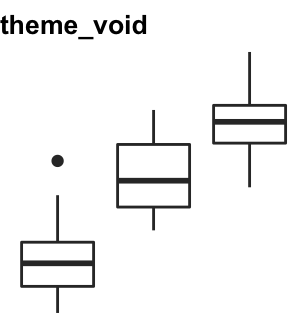
theme_dark(): Same as theme_light but with a dark background. Useful to make thin coloured lines pop out.theme_minimal(): A minimal theme with no background annotationstheme_classic(): A classic theme, with x and y axis lines and no gridlines.theme_void(): a completely empty theme, useful for plots with non-standard coordinates or for drawings.
p + theme_dark()

p + theme_minimal()

p + theme_classic()

p + theme_void()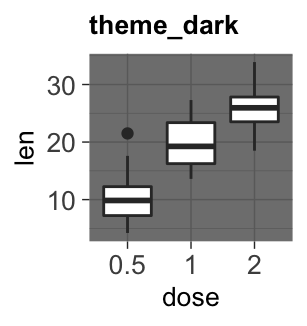
Use ggthemes
The R package ggthemes provides another gallery of custom ggplot themes, which include:
theme_tufte(): a minimalist themetheme_economist(): theme based on the plots in the economist magazinetheme_stata(): theme based on stata graph schemes.theme_hc(): theme based on Highcharts JS
To use these themes, first install and load the ggthemes package as follow :
install.packages("ggthemes") # Install

library(ggthemes) # Load
Then, create two basic ggplot: scatter plot and boxplot.
# Scatter plot
sp <- ggplot(mtcars, aes(wt, mpg)) +
geom_point()
sp
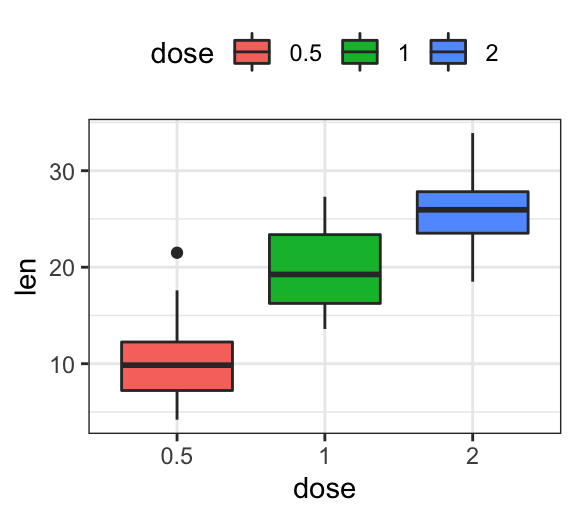
# Boxblot
ToothGrowth$dose <- as.factor(ToothGrowth$dose)
bxp <- ggplot(ToothGrowth, aes(x = dose, y = len)) +
geom_boxplot(aes(fill = dose))
bxp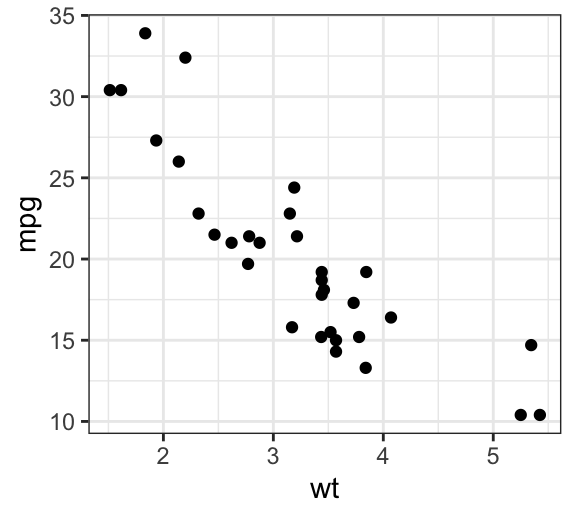
theme_tufte
Key R functions:
- theme_tufte(): set tufte theme
- geom_tufteboxplot(): Create tufte boxplot
- geom_rangeframe(): Extend axis lines to the maximum and the minimum of the plot data
Create a scatter plot with tufte theme:
library(ggthemes)
sp + geom_rangeframe() +  theme_tufte()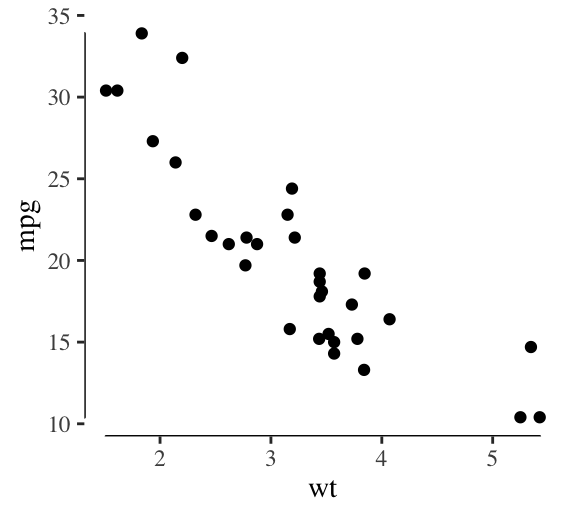
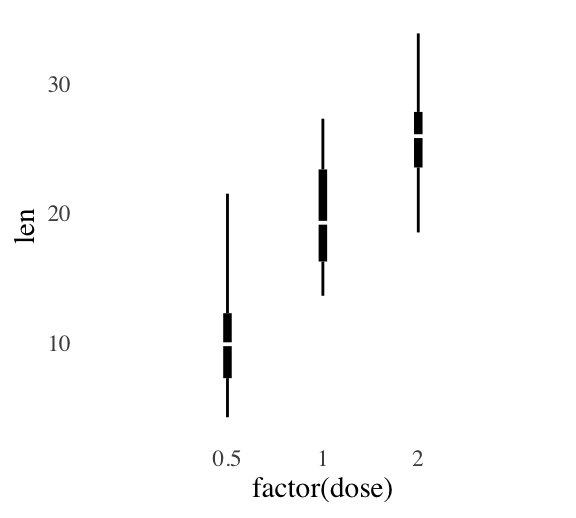
Create a tufte boxplot. The function `geom_tufteboxplot() creates several variants of Tufte’s minimal-ink boxplots. The following R code, will create two types of boxplots.
- Boxplot 1:
- a point indicates the median,
- a gap indicates the interquartile range,
- and lines the whiskers
- Boxplot 2:
- a wide line indicates interquartile range,
- a gap indicates the median,
- and lines indicate the minimum and maximum
p <- ggplot(ToothGrowth, aes(factor(dose), len)) +
  theme_tufte(ticks = FALSE)

# Box plot 1
p + geom_tufteboxplot()

# Box plot 2
p + geom_tufteboxplot(median.type = "line",
                      whisker.type = 'line',
                      hoffset = 0, width = 3)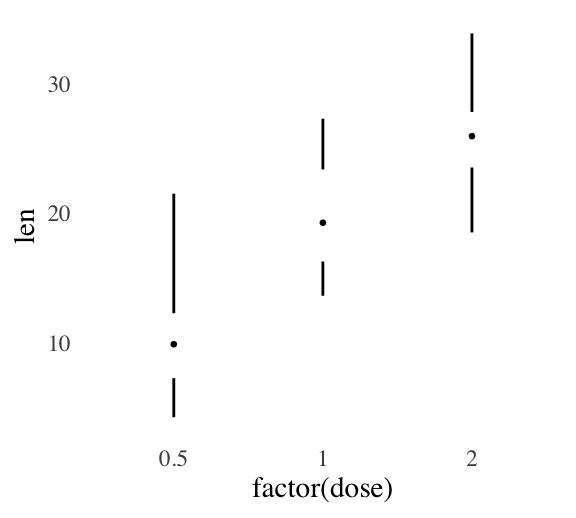
theme_economist
Key R functions:
- theme_economist()
- scale_fill_economist()
- scale_color_economist()
Create a boxplot with the economist theme:
bxp + theme_economist() + scale_fill_economist()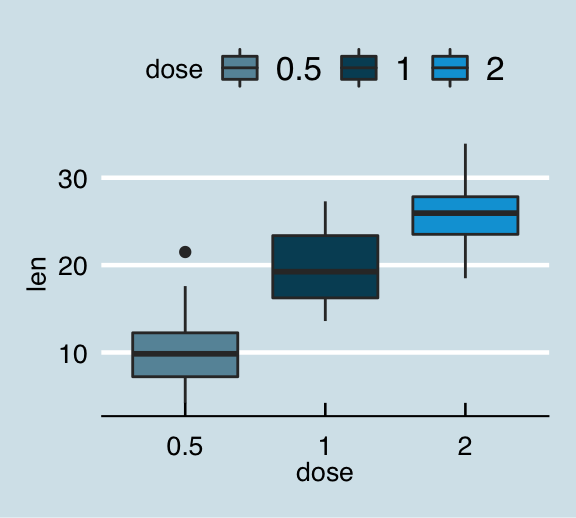
theme_stata
Key R functions:
- theme_stata()
- scale_fill_stata()
- scale_color_stata()
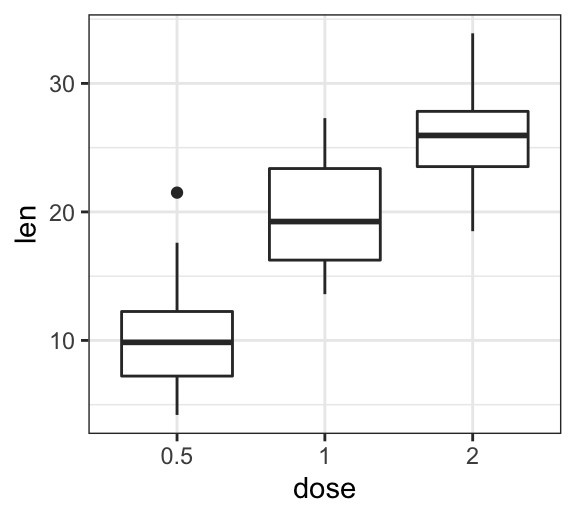
bxp + theme_stata() + scale_fill_stata()theme_hc
bxp + theme_hc()+ scale_colour_hc()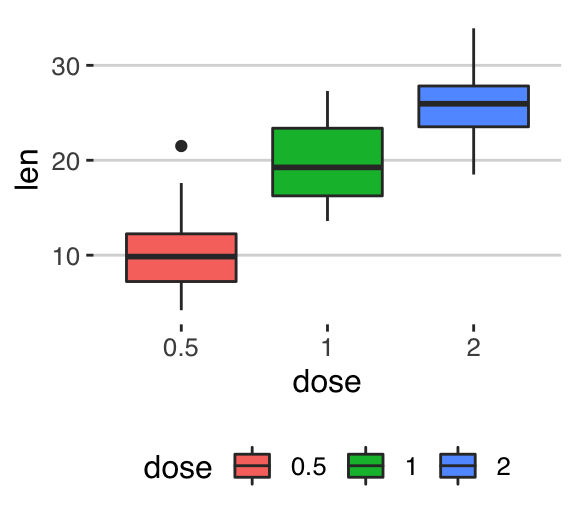
Override the current theme: theme_set
The function theme_set() can be used to change the theme for the entire session. It returns the old theme, so that we can restore it later.
p <- ggplot(ToothGrowth, aes(x = dose, y = len)) +
  geom_boxplot()
# Set theme_bw()
old.theme <- theme_set(theme_bw())
p

# Restore the old theme
theme_set(old.theme)
p
Change ggplot theme base_size and base_family
Note that, the theme functions can take the two arguments below :
- base_size: base font size (to change the size of all plot text elements)
- base_family: base font family
For example, the size of all the plot text elements can be easily changed at once, using:
p + theme_gray(base_size = 18, base_family = "Times")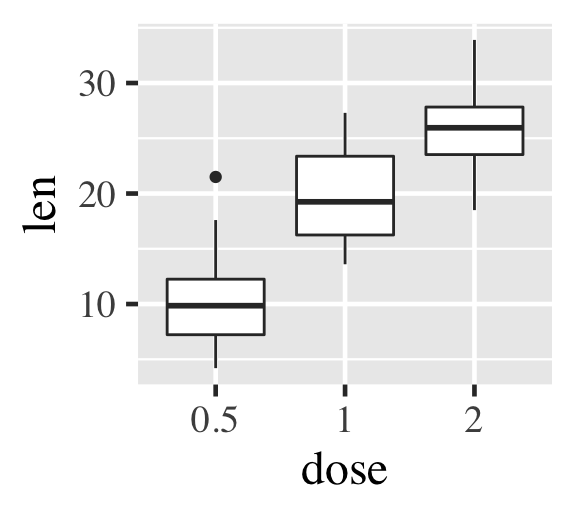
Create a custom theme
The function theme() is used to control non-data parts of a ggplot2 graph, including
- Line elements: axis lines, minor and major grid lines, plot panel border, axis ticks background color, etc.
- Text elements: plot title, axis titles, legend title and text, axis tick mark labels, etc.
- Rectangle elements: plot background, panel background, legend background, etc.
There is a specific function to modify each of these three elements :
element_line(color, size, linetype)to modify the line elements of the themeelement_text(face, color, size, hjust, vjust, angle)to modify the text elementselement_rect(fill, color, size, linetype)to modify the rectangle elements
Note that, each of the theme elements can be removed using the function element_blank().
The easiest way to create a custom theme is, for example, to extract and modify the R code of the function theme_gray() or any other theme functions [theme_bw(), theme_classic(), etc].
- Build your theme from scrach by starting with the source code of the function
theme_gray():
theme_gray

function (base_size = 11, base_family = "") {

 half_line <- base_size/2

theme(
  ...
  axis.text = element_text(size = rel(0.8), colour = "grey30"),
  ...
  )

}- Create a new theme called
theme_bluewhite()by starting with the source code of the functiontheme_bw(). We’ll replace only some theme elements.
# Create a new theme
theme_bluewhite <- function (base_size = 11, base_family = "") {
    theme_bw() %+replace%
    theme(
      panel.grid.major  = element_line(color = "white"),
      panel.background = element_rect(fill = "lightblue"),
      panel.border = element_rect(color = "lightblue", fill = NA),
      axis.line = element_line(color = "lightblue"),
      axis.ticks = element_line(color = "lightblue"),
      axis.text = element_text(color = "steelblue")
      )
}

# Using our new theme
ggplot(ToothGrowth, aes(dose, len)) +
  geom_boxplot() +
  theme_bluewhite()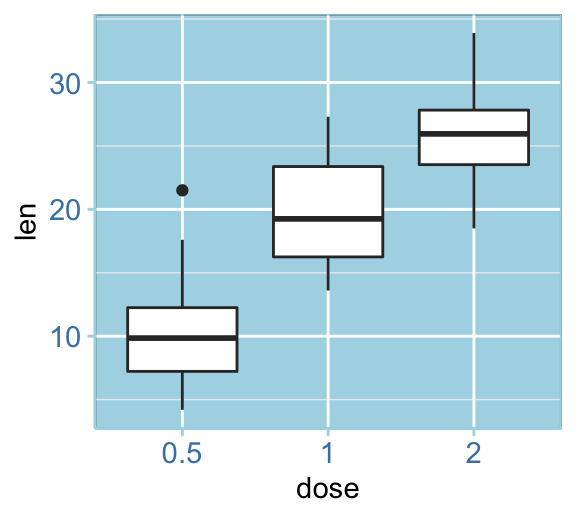
Conclusion
We present a list of ggplot themes to easily customize your graphs. We also describe how to create a custom ggplot theme.
The main points as shown below.
- Create an example of ggplot:
library(ggplot2)
p <- ggplot(ToothGrowth, aes(x = dose, y = len)) +
geom_boxplot()- Change ggplot the background theme by using one of the following professional themes:
- theme_bw(), theme_minimal(), theme_classic() and theme_dark() [in ggplot2 package]
- theme_tufte() and theme_economist() [in ggthemes]
p + theme_minimal()
Python Example for Beginners

Two Machine Learning Fields
There are two sides to machine learning:
- Practical Machine Learning:This is about querying databases, cleaning data, writing scripts to transform data and gluing algorithm and libraries together and writing custom code to squeeze reliable answers from data to satisfy difficult and ill defined questions. It’s the mess of reality.
- Theoretical Machine Learning: This is about math and abstraction and idealized scenarios and limits and beauty and informing what is possible. It is a whole lot neater and cleaner and removed from the mess of reality.
Data Science Resources: Data Science Recipes and Applied Machine Learning Recipes
Introduction to Applied Machine Learning & Data Science for Beginners, Business Analysts, Students, Researchers and Freelancers with Python & R Codes @ Western Australian Center for Applied Machine Learning & Data Science (WACAMLDS) !!!
Latest end-to-end Learn by Coding Recipes in Project-Based Learning:
Applied Statistics with R for Beginners and Business Professionals
Data Science and Machine Learning Projects in Python: Tabular Data Analytics
Data Science and Machine Learning Projects in R: Tabular Data Analytics
Python Machine Learning & Data Science Recipes: Learn by Coding
R Machine Learning & Data Science Recipes: Learn by Coding
Comparing Different Machine Learning Algorithms in Python for Classification (FREE)
Disclaimer: The information and code presented within this recipe/tutorial is only for educational and coaching purposes for beginners and developers. Anyone can practice and apply the recipe/tutorial presented here, but the reader is taking full responsibility for his/her actions. The author (content curator) of this recipe (code / program) has made every effort to ensure the accuracy of the information was correct at time of publication. The author (content curator) does not assume and hereby disclaims any liability to any party for any loss, damage, or disruption caused by errors or omissions, whether such errors or omissions result from accident, negligence, or any other cause. The information presented here could also be found in public knowledge domains.