GGPLOT LEGEND TITLE, POSITION AND LABELS
This R graphics tutorial shows how to customize a ggplot legend.
you will learn how to:
- Change the legend title and text labels
- Modify the legend position. In the default setting of ggplot2, the legend is placed on the right of the plot. We’ll show examples of how to move the legend to the bottom or to the top side of the plot. You’ll will also learn how to put the legend inside the plot.
- Reverse legend order. The easy way to reverse the order of legend items is to use the ggplot2 legend guides() function. It change the legend order for the specified aesthetic (fill, color, linetype, shape, size, etc). Example of R code:
p + guides(fill = guide_legend(reverse = TRUE))for color of area fills (e.g.: box plot and bar graph) orp + guides(color = guide_legend(reverse = TRUE))for point and line color (e.g.: scatter plot and line plot). - Remove a ggplot legend
- Remove the legend title:
p + theme(legend.title = element_blank()). - Hide the entire legend to create a ggplot with no legend. Example of R code:
p + theme(legend.position = "none"). - Hide legend for a specific geometry, say
geom_text(). Just specify the argumentshow.legend = FALSEin the given geometry. Example:geom_text(show.legend = FALSE).
- Remove the legend title:
- Change the legend theme
- Modify the font appearance (size, color / colour and face) of the legend title and text labels.
- Modify the legend background color, key size and key width.
- Rename legend labels and change the order of items in a given legend.
- Control the legend colors manually by specifying custom color values.
- Set ggplot legend guides for each aesthetic when you have many legends. R function: guides()
- Change the legend order in the situation where you have multiple legends (or multiple guides) generated by using multiple aesthetics (shape, color, size, fill, etc) in the plot. For example, you might have one legend for point shape and another for point color and size.
- Remove the legend for a specific aesthetic, say the legend for shape.
Contents:
- Key ggplot2 R functions
- Change legend title
- Change legend position
- Reverse the order of legend items
- Remove legend
- Change the legend font size, color and face
- Change legend background color, key size and width
- Rename legend labels and change the order of items
- Change legend colors manually
- Multiple guides: Remove and order legends
- Conclusion
Key ggplot2 R functions
Start by creating a box plot using the ToothGrowth data set. Change the box plot fill color according to the grouping variable dose.
library(ggplot2)
ToothGrowth$dose <- as.factor(ToothGrowth$dose)
p <- ggplot(ToothGrowth, aes(x = dose, y = len))+
  geom_boxplot(aes(fill = dose)) # Change fill color by groups
Key R functions to change ggplot legends:
- p + labs(). Change legend title.
- Use p + labs(fill = “dose”) for geom_boxplot(aes(fill = dose))
- Use p + labs(color = “dose”) for geom_boxplot(aes(color = dose))
- and so on for linetype, shape, etc
- p + theme(…). Change legend theme: background color, legend box border, font size and color.
- p + scale_x_discrete(limits = c(“2”, “0.5”, “1”)). Change the order of the item in the legend.
- p + scale_fill_discrete(name = “Dose”, labels = c(“A”, “B”, “C”)). Rename the legend title and text labels.
- guides(). Change legend order and remove a specific legend of aesthetics, when you have multiple legends.
Essential ggplot2 theme options for legend:
theme(
    # Legend title and text labels
    #:::::::::::::::::::::::::::::::::::::::::::::::::::::::::::
    # Title font color size and face
    legend.title = element_text(color, size, face),
    # Title alignment. Number from 0 (left) to 1 (right)
    legend.title.align = NULL,
    # Text label font color size and face
    legend.text = element_text(color, size, face),
    # Text label alignment. Number from 0 (left) to 1 (right)
    legend.text.align = NULL,

    # Legend position, margin and background
    #:::::::::::::::::::::::::::::::::::::::::::::::::::::::::::
    # Legend position: right, left, bottom, top, none
    legend.position = "right",
    # Margin around each legend
    legend.margin = margin(0.2, 0.2, 0.2, 0.2, "cm"),
    # Legend background
    legend.background = element_rect(fill, color, size, linetype),

    # Legend direction and justification
    #:::::::::::::::::::::::::::::::::::::::::::::::::::::::::::
    # Layout of items in legends ("horizontal" or "vertical")
    legend.direction = NULL,
    # Positioning legend inside or outside plot
    # ("center" or two-element numeric vector)
    legend.justification = "center",

    # Background underneath legend keys
    #:::::::::::::::::::::::::::::::::::::::::::::::::::::::::::
    legend.key = element_rect(fill, color),  # Key background
    legend.key.size = unit(1.2, "lines"),    # key size (unit)
    legend.key.height = NULL,                # key height (unit)
    legend.key.width = NULL,                 # key width (unit)

    # Spacing between legends.
    #:::::::::::::::::::::::::::::::::::::::::::::::::::::::::::
    legend.spacing = unit(0.4, "cm"),
    legend.spacing.x = NULL,                 # Horizontal spacing
    legend.spacing.y = NULL,                 # Vertical spacing

    # Legend box
    #:::::::::::::::::::::::::::::::::::::::::::::::::::::::::::
    # Arrangement of multiple legends ("horizontal" or "vertical")
    legend.box = NULL,
    # Margins around the full legend area
    legend.box.margin = margin(0, 0, 0, 0, "cm"),
    # Background of legend area: element_rect()
    legend.box.background = element_blank(),
    # The spacing between the plotting area and the legend box
    legend.box.spacing = unit(0.4, "cm")
)
To blank the legend title, use element_blank() for the corresponding theme option. For example, use this: p + theme(legend.title = element_blank()).
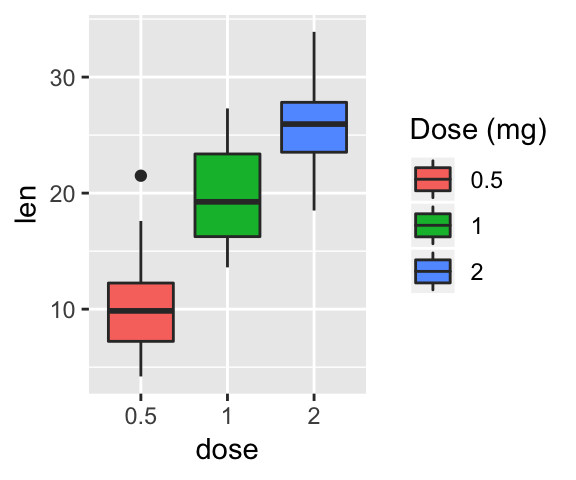
Change legend title
The function labs() can be used to easily update the legend title for a given aesthetic (fill, color, size, shape, linetype, …):
# Default plot
print(p)

# Modify legend titles
p + labs(fill = "Dose (mg)")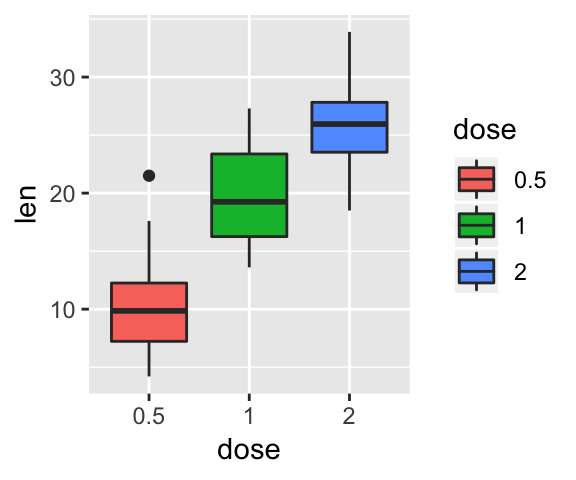
Change legend position
Allowe values for the legend position is: “left”,“top”, “right”, “bottom”, “none”.
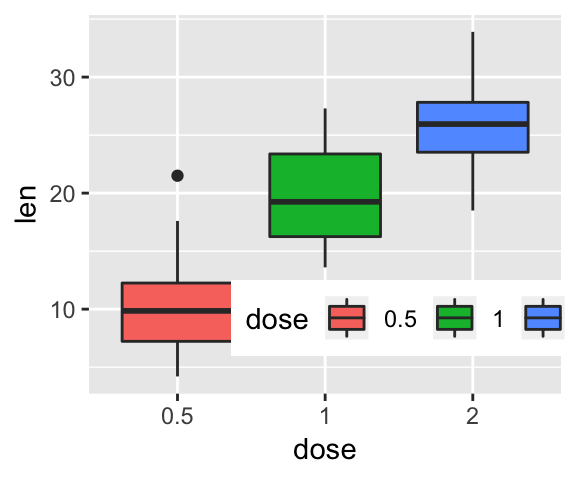
Legend loction can be also a numeric vector c(x,y), where x and y are the coordinates of the legend box. Their values should be between 0 and 1. c(0,0) corresponds to the “bottom left” and c(1,1) corresponds to the “top right” position. This makes it possible to place the legend inside the plot.
# Set legend position to top
p + theme(legend.position="top")

# Set legend position as numeric vector c(x, y)
# Place the legend inside the plot
p + theme(legend.position = c(0.7, 0.2),
          legend.direction = "horizontal")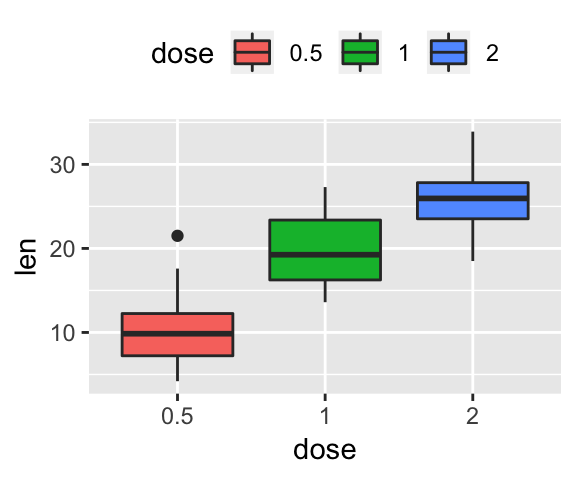
Reverse the order of legend items
To change the order of legend items in our example, where the box plot areas are filled by groups, you can use either the function guides() or scale_fill_discrete() as follow:
# Use guides function to reverse legend for
# a specific aesthetic (fill, linetype, shape or color)
p + guides(fill = guide_legend(reverse=TRUE))

# Or use scale_fill_discrete (same as above)
p + scale_fill_discrete(guide = guide_legend(reverse=TRUE))

# Or modify directly the scale (same as above)
p + scale_fill_discrete(breaks = rev(levels(ToothGrowth$dose)))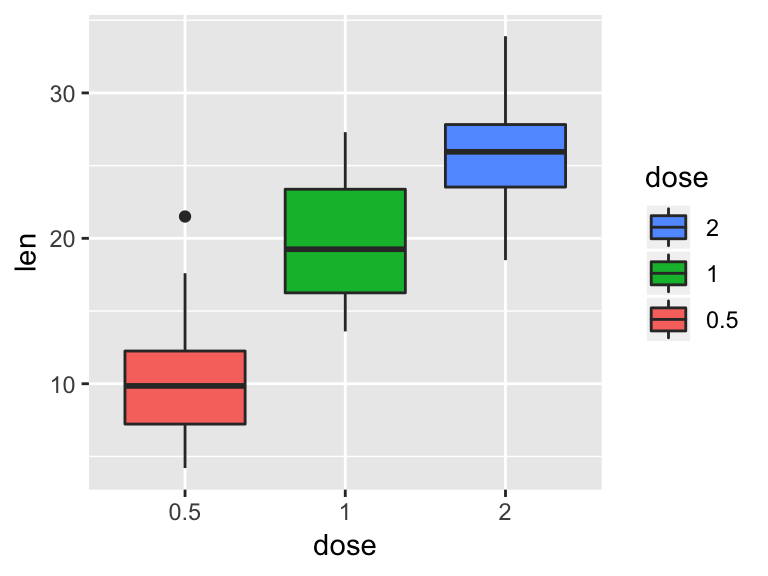
Remove legend
You can suppress the legend as follow:
p + theme(legend.position = "none")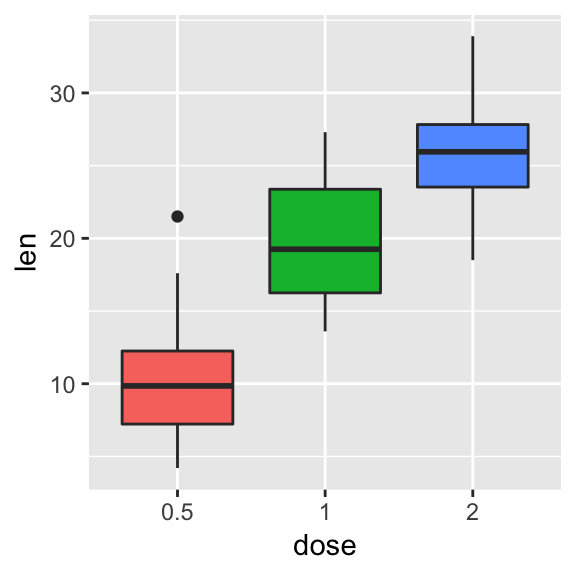
Change the legend font size, color and face
The following R code changes legend size and text color:
# Change the appearance of legend title and text labels
p + theme(legend.title = element_text(color = "blue", size = 10),
          legend.text = element_text(color = "red"))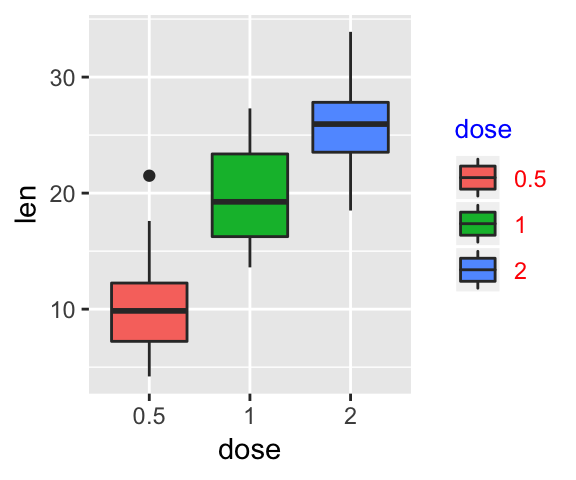
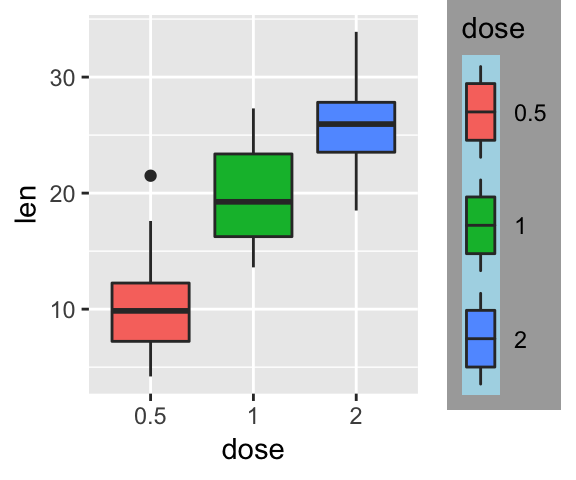
Change legend background color, key size and width
p + theme(
  # Change legend background color
  legend.background = element_rect(fill = "darkgray"),
  legend.key = element_rect(fill = "lightblue", color = NA),
  # Change legend key size and key width
  legend.key.size = unit(1.5, "cm"),
  legend.key.width = unit(0.5,"cm")
  )
To add a border to the legend box, you can specify the following arguments in the function element_rect():
linetype, which values include one of: “solid”, “dashed”, …colorandsize, to change the box border line color and size, respectively
For example:
p + theme(
legend.background = element_rect(color = "steelblue", linetype = "solid")
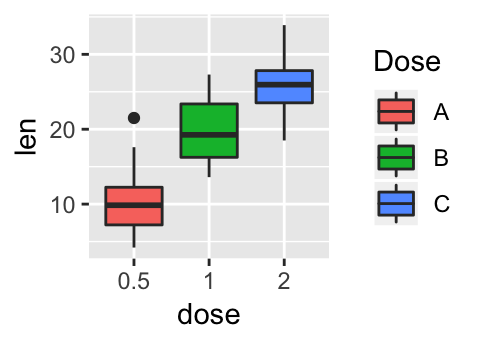
)Rename legend labels and change the order of items
This can be done using the scale functions:
- Change the order of legend items:
scale_x_discrete() - Edit legend title and text labels:
scale_fill_discrete()
# Change the order of legend items
p + scale_x_discrete(limits=c("2", "0.5", "1"))

# Edit legend title and labels
p + scale_fill_discrete(name = "Dose", labels = c("A", "B", "C"))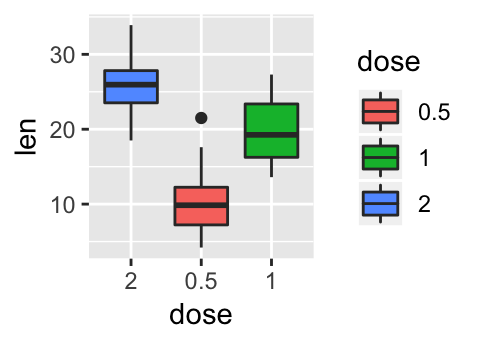
Other discrete scales include:
# Color of lines and points
scale_color_discrete(name, labels, limits, breaks)
# For linetypes
scale_linetype_discrete(name, labels, limits, breaks)
# For point shapes
scale_shape_discrete(name, labels, limits, breaks)
# For point size
scale_size_discrete(name, labels, limits, breaks)
# Opacity/transparency
scale_alpha_discrete(name, labels, limits, breaks)
Change legend colors manually
The functions below can be used to manually modify the color of the legend:
- scale_color_manual() or scale_colour_manual(): Modify the color of points and lines.
- scale_fill_manual(): Modify the color of area fills (for bar plot and box plot)
p + scale_fill_manual(values = c("#d8b365", "#f5f5f5", "#5ab4ac"))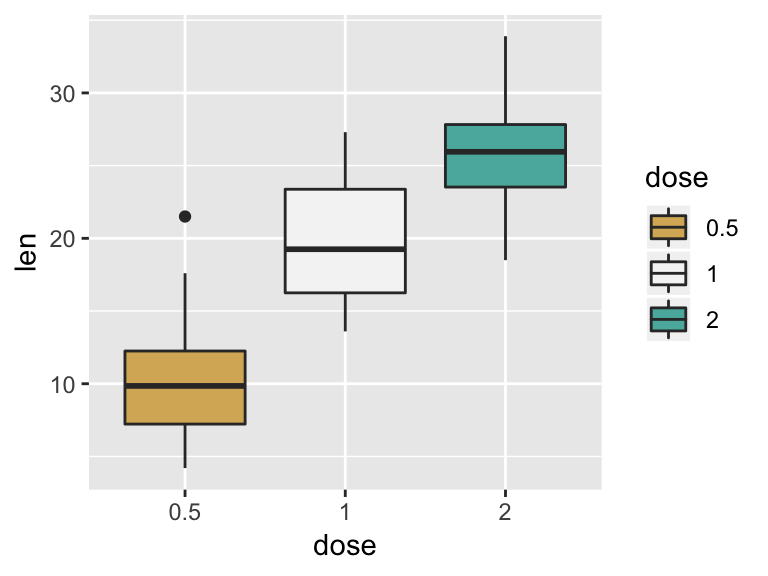
Multiple guides: Remove and order legends
It’s possible to use the function guides() to set or remove the legend of a particular aesthetic (fill, color, size, shape, etc).
- Data:
mtcars. Convertcylandgearto factor variables:
mtcars$cyl<-as.factor(mtcars$cyl)
mtcars$gear <- as.factor(mtcars$gear)- Create a scatter plot with multiple aesthetics (guides). The color and the shape of the points are determined by the factor variables
cylandgear, respectively. The size of the points are controlled by the variable qsec.
p <- ggplot(data = mtcars, aes(x = mpg, y = wt))+
    geom_point(aes(color = cyl, size = qsec, shape = gear))
p
- Change legend position for multiple guides:
p + theme(legend.position = "bottom",
          legend.box = "vertical")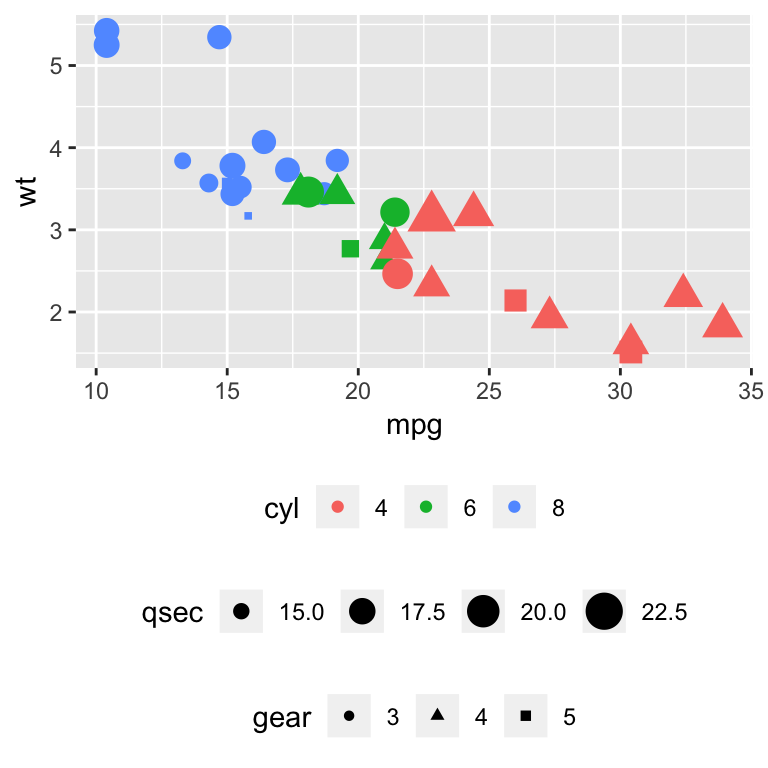
- Change the order of legend using the function
guide_legend():
p + guides(color = guide_legend(order = 1),
         size = guide_legend(order = 2),
         shape = guide_legend(order = 3))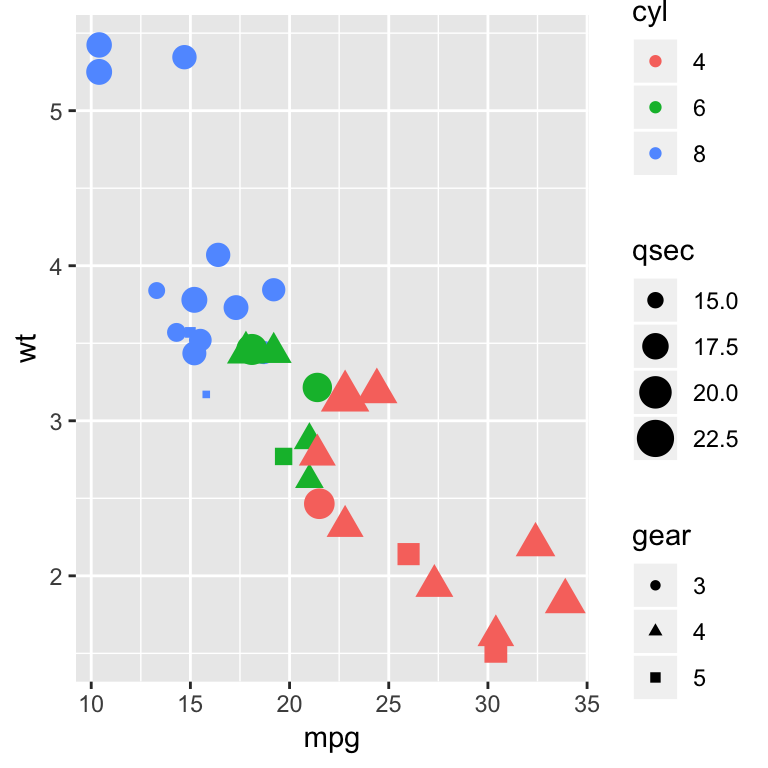
Note that, in the case of continuous color, the function guide_colourbar() should be used to change the order of color guide.
ggplot(data = mpg, aes(x = displ, y = cty))+
  geom_point(aes(size = hwy, color = cyl, shape = drv))+
  guides(colour = guide_colourbar(order = 1),
         alpha = guide_legend(order = 2),
         size = guide_legend(order = 3))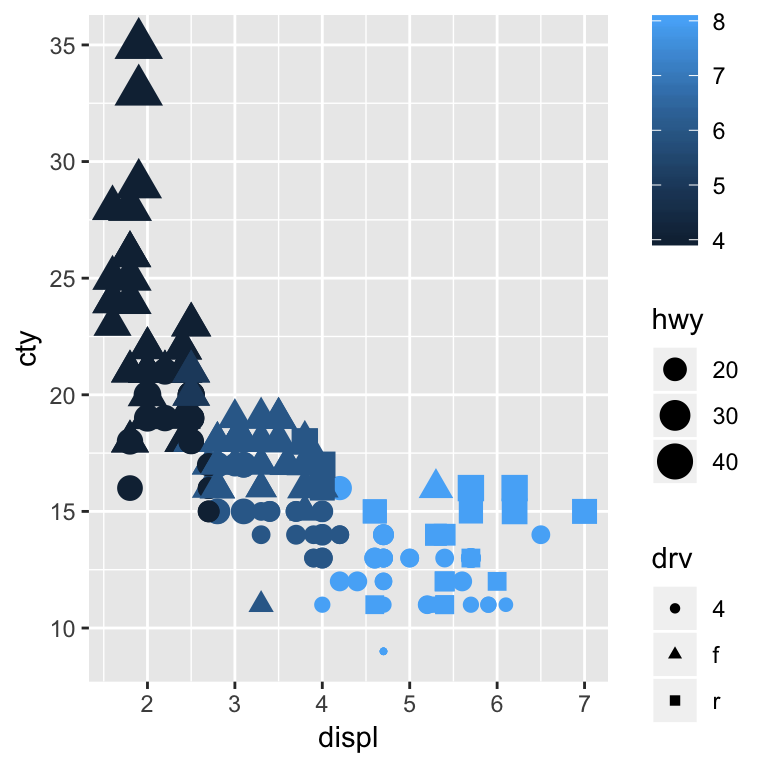
- Remove a legend for a particular aesthetic (color and size):
p + guides(color = FALSE, size = FALSE)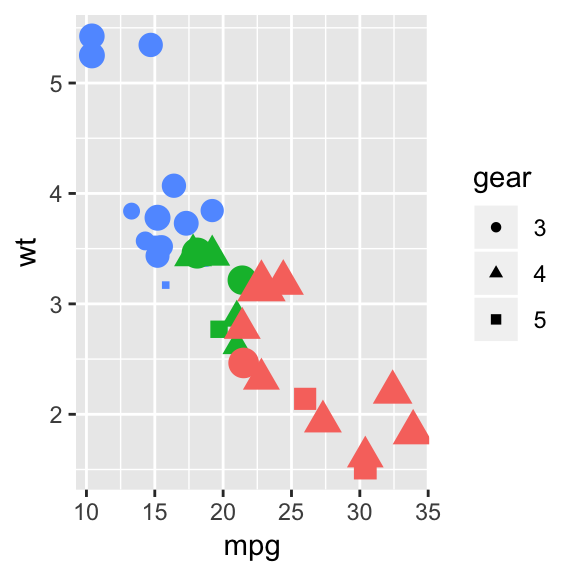
Removing a particular legend can be also done when using the scale_xx() functions. In this case the argument guide is used as follow.
# Turn off legend for the point shape
p + scale_shape(guide=FALSE)
# Turn off legend for size
p + scale_size(guide=FALSE)
# Turn off legend legend for color
p + scale_color_manual(values=c('#999999','#E69F00','#56B4E9'),
                       guide=FALSE)
Conclusion
We introduce how to easily change a ggplot legend title, position and labels. The different steps are summarized as follow.
- Create an example of ggplot:
library(ggplot2)
p <- ggplot(ToothGrowth, aes(x = factor(dose), y = len)) +
geom_boxplot()- Change legend title for a given aesthetic (fill, color, size, shape, linetype, …):
p + labs(fill = "Dose (mg)")- Remove legend:
p + theme(legend.position = "none")- Change legend position. Possible values: “left”,“top”, “right”, “bottom”, “none”.
p + theme(legend.position = "top")Python Example for Beginners

Two Machine Learning Fields
There are two sides to machine learning:
- Practical Machine Learning:This is about querying databases, cleaning data, writing scripts to transform data and gluing algorithm and libraries together and writing custom code to squeeze reliable answers from data to satisfy difficult and ill defined questions. It’s the mess of reality.
- Theoretical Machine Learning: This is about math and abstraction and idealized scenarios and limits and beauty and informing what is possible. It is a whole lot neater and cleaner and removed from the mess of reality.
Data Science Resources: Data Science Recipes and Applied Machine Learning Recipes
Introduction to Applied Machine Learning & Data Science for Beginners, Business Analysts, Students, Researchers and Freelancers with Python & R Codes @ Western Australian Center for Applied Machine Learning & Data Science (WACAMLDS) !!!
Latest end-to-end Learn by Coding Recipes in Project-Based Learning:
Applied Statistics with R for Beginners and Business Professionals
Data Science and Machine Learning Projects in Python: Tabular Data Analytics
Data Science and Machine Learning Projects in R: Tabular Data Analytics
Python Machine Learning & Data Science Recipes: Learn by Coding
R Machine Learning & Data Science Recipes: Learn by Coding
Comparing Different Machine Learning Algorithms in Python for Classification (FREE)
Disclaimer: The information and code presented within this recipe/tutorial is only for educational and coaching purposes for beginners and developers. Anyone can practice and apply the recipe/tutorial presented here, but the reader is taking full responsibility for his/her actions. The author (content curator) of this recipe (code / program) has made every effort to ensure the accuracy of the information was correct at time of publication. The author (content curator) does not assume and hereby disclaims any liability to any party for any loss, damage, or disruption caused by errors or omissions, whether such errors or omissions result from accident, negligence, or any other cause. The information presented here could also be found in public knowledge domains.
Google –> SETScholars