GGPLOT DATE AXIS CUSTOMIZATION
This article describes how to format ggplot date axis using the R functions scale_x_date() and scale_y_date().
In this R graphics tutorial, you’ll learn how to:
- Change date axis labels using different combinations of days, weeks, months, year
- Modify date axis limits.
Contents:
- Key ggplot2 R functions
- Time series data
- Create a simple ggplot with date axis
- Format date axis labels: scale_x_date
- Set date axis limits
- Conclusion
Key ggplot2 R functions
scale_x_date(date_labels, limits)andscale_y_date(date_labels, limits): Format date axesscale_x_datetime(date-labels, limits)and `scale_y_datetime(date_labels, limits): Format a datetime axis
Time series data
Create some time series data sets:
set.seed(1234)
last_month <- Sys.Date() - 0:29
df <- data.frame(
  date = last_month,
  price = runif(30)
)
head(df)
## date price
## 1 2018-11-13 0.114
## 2 2018-11-12 0.622
## 3 2018-11-11 0.609
## 4 2018-11-10 0.623
## 5 2018-11-09 0.861
## 6 2018-11-08 0.640Create a simple ggplot with date axis
library(ggplot2)
p <- ggplot(data=df, aes(x = date, y = price)) +
  geom_line()
p
Format date axis labels: scale_x_date
To format date axis labels, you can use different combinations of days, weeks, months and years:
- Weekday name: use
%aand%Afor abbreviated and full weekday name, respectively - Month name: use
%band%Bfor abbreviated and full month name, respectively %d: day of the month as decimal number%U: week of the year as decimal number (00–53)%Y: Year with century.- See more options in the documentation of the function
?strptime
# Format : month/day
p + scale_x_date(date_labels = "%b/%d")
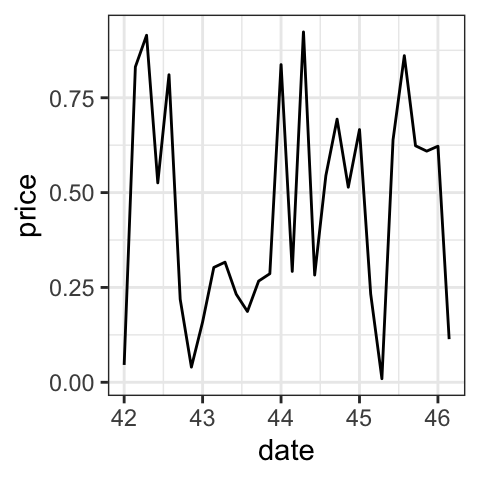
# Format : Week
p + scale_x_date(date_labels = "%U")
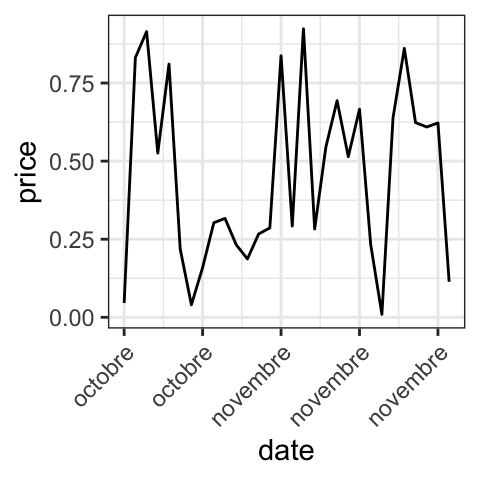
# Months only
p + scale_x_date(date_labels = "%B")+
theme(axis.text.x = element_text(angle=45, hjust = 1))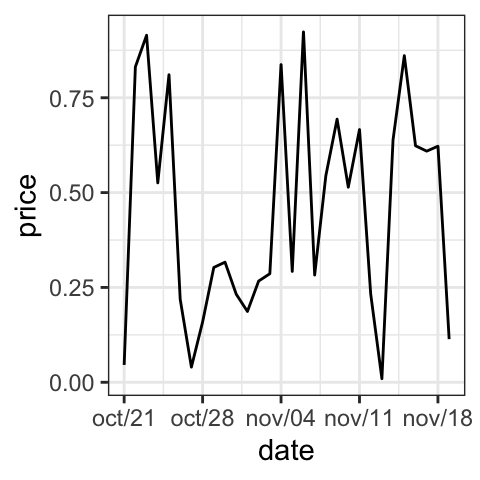
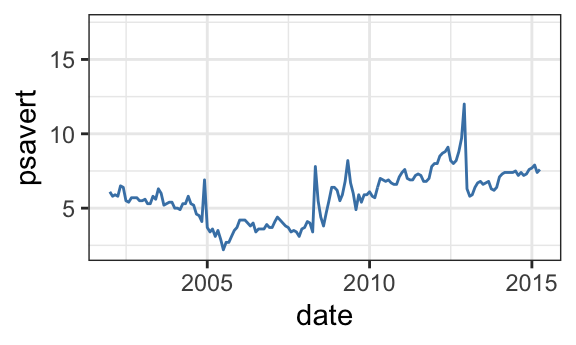
Set date axis limits
Use the economics time series data sets [in ggplot2]:
data("economics")
# Base plot with date axis
p <- ggplot(data = economics, aes(x = date, y = psavert)) +
     geom_line(color = "steelblue")
p

# Set axis limits c(min, max)
min <- as.Date("2002-1-1")
max <- NA
p + scale_x_date(limits = c(min, max))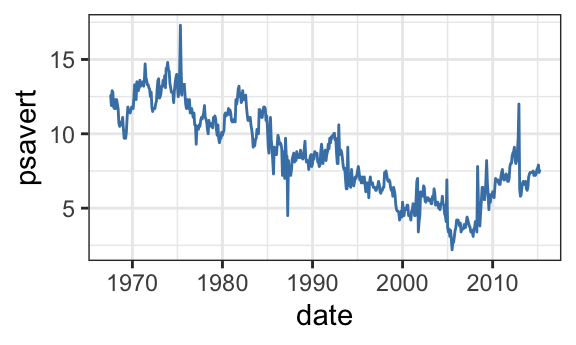
Conclusion
To change the format of data axis labels, first read the help page of the R base function strptime() to see the available date format.
Then, use the following example of R code:
p + scale_x_date(date_labels = "%b/%d")Python Example for Beginners

Two Machine Learning Fields
There are two sides to machine learning:
- Practical Machine Learning:This is about querying databases, cleaning data, writing scripts to transform data and gluing algorithm and libraries together and writing custom code to squeeze reliable answers from data to satisfy difficult and ill defined questions. It’s the mess of reality.
- Theoretical Machine Learning: This is about math and abstraction and idealized scenarios and limits and beauty and informing what is possible. It is a whole lot neater and cleaner and removed from the mess of reality.
Data Science Resources: Data Science Recipes and Applied Machine Learning Recipes
Introduction to Applied Machine Learning & Data Science for Beginners, Business Analysts, Students, Researchers and Freelancers with Python & R Codes @ Western Australian Center for Applied Machine Learning & Data Science (WACAMLDS) !!!
Latest end-to-end Learn by Coding Recipes in Project-Based Learning:
Applied Statistics with R for Beginners and Business Professionals
Data Science and Machine Learning Projects in Python: Tabular Data Analytics
Data Science and Machine Learning Projects in R: Tabular Data Analytics
Python Machine Learning & Data Science Recipes: Learn by Coding
R Machine Learning & Data Science Recipes: Learn by Coding
Comparing Different Machine Learning Algorithms in Python for Classification (FREE)
Disclaimer: The information and code presented within this recipe/tutorial is only for educational and coaching purposes for beginners and developers. Anyone can practice and apply the recipe/tutorial presented here, but the reader is taking full responsibility for his/her actions. The author (content curator) of this recipe (code / program) has made every effort to ensure the accuracy of the information was correct at time of publication. The author (content curator) does not assume and hereby disclaims any liability to any party for any loss, damage, or disruption caused by errors or omissions, whether such errors or omissions result from accident, negligence, or any other cause. The information presented here could also be found in public knowledge domains.
Google –> SETScholars