Bar Plot in Python
A bar plot shows catergorical data as rectangular bars with the height of bars proportional to the value they represent. It is often used to compare between values of different categories in the data.
Content
- What is a barplot?
- Simple bar plot using matplotlib
- Horizontal barplot
- Changing color of a barplot
- Grouped and Stacked Barplots
- Grouped barplot
- Stacked barplot
- List of available palettes
What is a barplot?
A bar plot shows catergorical data as rectangular bars with heights proportional to the value they represent. It is often used to compare between values of different categories in the data.
What is categorical data?
A categorical data is nothing but a grouping of data into different logical groups, for example, data on the height of persons being grouped as ‘Tall’, ‘Medium’, ‘Short’ etc.
To make a bar plot, you need to calculate the count of each category.
First you need to install all the required libraries which we will be using. I also changed the default figsize and dpi (dots per inch) parameters by using plt.rcParams.update() function.
import numpy as np
import pandas as pd
import matplotlib.pyplot as plt
%matplotlib inline
plt.rcParams.update({'figure.figsize':(7,5), 'figure.dpi':100})
Lets create a dataset containing 10 discrete categories and assign values to each catergory.
To create a random array, use np.random.randn() function with lower limit, upper limit and size of the array as arguments.
/* Create Data */
x=['A','B','C','D','E','F','G','H','I','J']
y = np.random.randint(low=0, high=100, size=10)
yarray([47, 23, 27, 0, 82, 7, 46, 92, 36, 76])You can see that y contains an array of randomly assigned values
Simple bar plot using matplotlib
For plotting a barplot in matplotlib, use plt.bar() function passing 2 arguments – ( x_value , y_value)
/* Simple Bar Plot */
plt.bar(x,y)
plt.xlabel('Categories')
plt.ylabel("Values")
plt.title('Categories Bar Plot')
plt.show()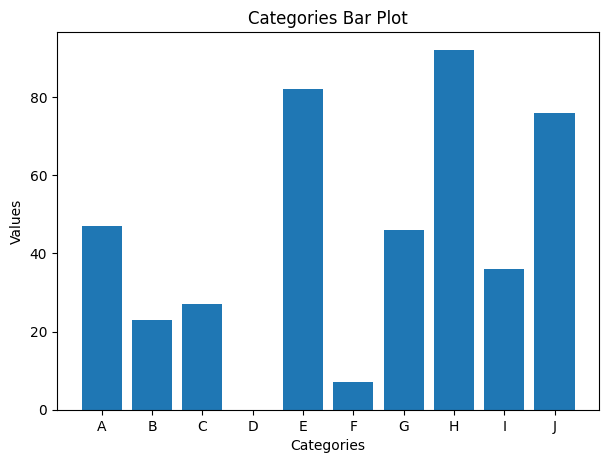
In the above barplot we can visualize the array we just created using random() function.
Horizontal barplot
You can also visualize the same graph horizontally using the barh() function with the same values as arguments.
/* Horizontal Bar plot */
plt.barh(x,y)
plt.xlabel("Values")
plt.ylabel('Categories')
plt.title('Horizontal Bar Plot')
plt.show()
Changing color of a barplot
You can also change the color of the bar by using the [color= ‘ ‘] command in the plt.bar() fucntion.
/* Change color of each bar */
plt.bar(x,y, color=['firebrick', 'green', 'blue', 'black', 'red',
                    'purple', 'seagreen', 'skyblue', 'black', 'tomato'])
plt.xlabel('Categories')
plt.ylabel("Values")
plt.title('Barplot with colored bars')
plt.show()
Grouped and Stacked Barplots
There are 2 types of barplots – Grouped and stacked barplots.
Let’s look into this with an example of the famous titanic dataset.
This dataset contains the data of whether the person has survived or not during the sink of titanic and different details of the person.
You can download the below used dataset from the link.
Grouped barplot
In a grouped bar chart, for each categorical group there are two or more bars.
/* Import data */
df=pd.read_csv("titanic.csv")
df.head()
If you want to plot Grouped barplots then use seaborn package using hue='groupColumnName' which will contain the category which you are grouping into x.
So basically you are splitting the x('Sex') category further into categories 'Pclass' .
This is called as grouped barplot.
/* Grouped bar plot with seaborn */
import seaborn as sns
sns.barplot(y='Survived',x='Sex',hue='Pclass',data=df);
Let’s see another example.
/* Another example */
sns.barplot(y='Survived',x='Sex',hue='SibSp',data=df);
You can also see the error bar for each category.
Error bars are graphical representations of the variability of data and used on graphs to indicate the error or uncertainty in a reported measurement.
Error bars often represent one standard deviation of uncertainty, one standard error, or a particular confidence interval (e.g., a 95% interval).
Stacked barplot
The stacked bar chart stacks bars that represent different groups on top of each other.
This can be done in pandas library by using stacked='True' command in df.plot() function.
/* Stacked barplot with pandas */
survived = df.loc[df['Survived']==1, :]['Pclass'].value_counts()
died     = df.loc[df['Survived']==0, :]['Pclass'].value_counts()
df_plot  = pd.DataFrame([survived,died])
df_plot.index=['survived','died']

# Plot
df_plot.plot(kind='bar',stacked=True, title='Stacked Bar plot');
The above graph is categorized based on whether the passenger survived or not and also stacked based on the class in which the passenger is traveling.
Let’s draw with different palette.
/* Stacked barplot with pandas with differnt palette */
survived = df.loc[df['Survived']==1, :]['Sex'].value_counts()
died     = df.loc[df['Survived']==0, :]['Sex'].value_counts()
df_plot  = pd.DataFrame([survived,died])
df_plot.index=['survived','died']

/* Bar plot */
df_plot.plot(kind='bar',stacked=True, colormap='Spectral', title='Stacked Bar plot with Spectral Palette');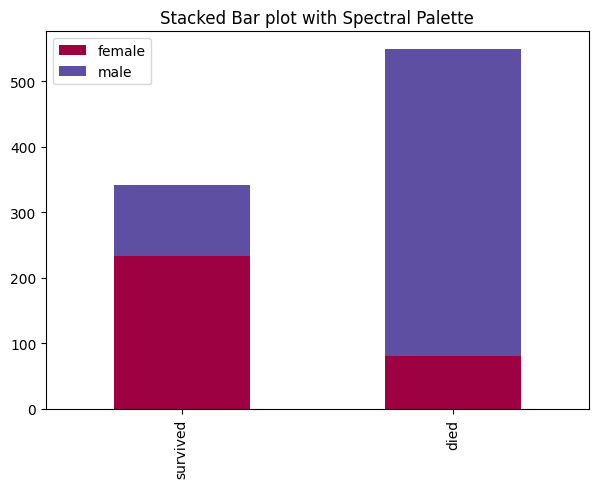
The above graph is categorized based on whether the passenger survived or not and also stacked based on the number of siblings of each passenger.
The difference between the 2 barplots is that Grouped bar graphs usually present the information in the same order in each grouping whereas Stacked bar graphs present the information in the same sequence on each bar.
List of available palettes
/* List of available Palettes  */
import matplotlib.cm as cm
maps=[m for m in cm.datad if not m.endswith("_r")]
print(maps)['Blues', 'BrBG', 'BuGn', 'BuPu', 'CMRmap', 'GnBu', 'Greens', 'Greys', 'OrRd', 'Oranges',
'PRGn', 'PiYG', 'PuBu', 'PuBuGn', 'PuOr', 'PuRd', 'Purples', 'RdBu', 'RdGy', 'RdPu', 'RdYlBu', 'RdYlGn',
'Reds', 'Spectral', 'Wistia', 'YlGn', 'YlGnBu', 'YlOrBr', 'YlOrRd', 'afmhot', 'autumn', 'binary', 'bone',
'brg', 'bwr', 'cool', 'coolwarm', 'copper', 'cubehelix', 'flag', 'gist_earth', 'gist_gray', 'gist_heat',
'gist_ncar', 'gist_rainbow', 'gist_stern', 'gist_yarg', 'gnuplot', 'gnuplot2', 'gray', 'hot', 'hsv', 'jet',
'nipy_spectral', 'ocean', 'pink', 'prism', 'rainbow', 'seismic', 'spring', 'summer', 'terrain', 'winter',
'Accent', 'Dark2', 'Paired', 'Pastel1', 'Pastel2', 'Set1', 'Set2', 'Set3', 'tab10', 'tab20', 'tab20b',
'tab20c']
Python Example for Beginners

Two Machine Learning Fields
There are two sides to machine learning:
- Practical Machine Learning:This is about querying databases, cleaning data, writing scripts to transform data and gluing algorithm and libraries together and writing custom code to squeeze reliable answers from data to satisfy difficult and ill defined questions. It’s the mess of reality.
- Theoretical Machine Learning: This is about math and abstraction and idealized scenarios and limits and beauty and informing what is possible. It is a whole lot neater and cleaner and removed from the mess of reality.
Data Science Resources: Data Science Recipes and Applied Machine Learning Recipes
Introduction to Applied Machine Learning & Data Science for Beginners, Business Analysts, Students, Researchers and Freelancers with Python & R Codes @ Western Australian Center for Applied Machine Learning & Data Science (WACAMLDS) !!!
Latest end-to-end Learn by Coding Recipes in Project-Based Learning:
Applied Statistics with R for Beginners and Business Professionals
Data Science and Machine Learning Projects in Python: Tabular Data Analytics
Data Science and Machine Learning Projects in R: Tabular Data Analytics
Python Machine Learning & Data Science Recipes: Learn by Coding
R Machine Learning & Data Science Recipes: Learn by Coding
Comparing Different Machine Learning Algorithms in Python for Classification (FREE)
Disclaimer: The information and code presented within this recipe/tutorial is only for educational and coaching purposes for beginners and developers. Anyone can practice and apply the recipe/tutorial presented here, but the reader is taking full responsibility for his/her actions. The author (content curator) of this recipe (code / program) has made every effort to ensure the accuracy of the information was correct at time of publication. The author (content curator) does not assume and hereby disclaims any liability to any party for any loss, damage, or disruption caused by errors or omissions, whether such errors or omissions result from accident, negligence, or any other cause. The information presented here could also be found in public knowledge domains.